Calculate P Value in Excel
Introduction to P-Value Calculation in Excel
The p-value, or probability value, is a key concept in statistical hypothesis testing, representing the probability of observing results at least as extreme as those observed, assuming that the null hypothesis is true. In Excel, calculating the p-value can be somewhat complex, but it can be achieved using various formulas and functions, depending on the type of test being performed. This guide will walk you through the steps to calculate the p-value for different statistical tests in Excel.
Understanding P-Value

Before diving into the calculation, it’s essential to understand what the p-value represents. The p-value is a numerical value between 0 and 1 that indicates the strength of evidence against a null hypothesis. A small p-value (typically less than 0.05) suggests strong evidence against the null hypothesis, leading to its rejection, while a large p-value indicates weak evidence, suggesting the null hypothesis should not be rejected.
Calculating P-Value in Excel for a Z-Test
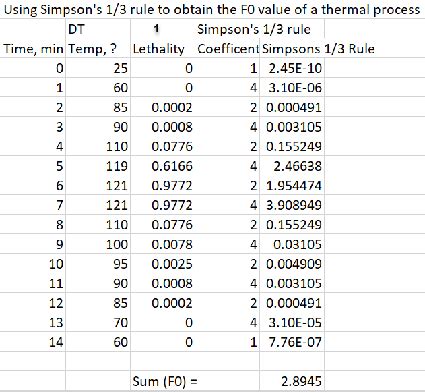
For a Z-test, which is used when the population standard deviation is known, the p-value can be calculated using the Z-score formula and then looking up this score in the standard normal distribution (Z-distribution) to find the corresponding probability (p-value).
- First, calculate the Z-score using the formula: Z = (X - μ) / (σ / √n), where X is the sample mean, μ is the population mean, σ is the population standard deviation, and n is the sample size.
- Then, use the
NORM.S.DISTfunction in Excel to find the p-value. The syntax isNORM.S.DIST(z, cumulative), wherezis the Z-score you calculated, andcumulativeis a logical value that indicates whether to return the cumulative distribution function (TRUE) or the probability density function (FALSE). For a two-tailed test, you would use2 * (1 - NORM.S.DIST(abs(z), TRUE)).
Calculating P-Value in Excel for a T-Test
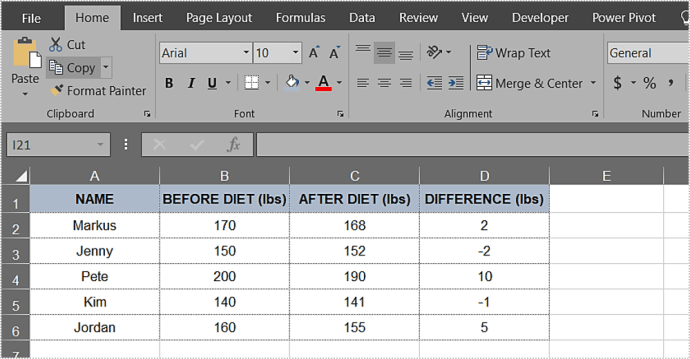
For a T-test, used when the population standard deviation is unknown, Excel provides a built-in function to calculate the p-value directly.
- Use the
T.TESTfunction, which has the syntaxT.TEST(array1, array2, tails, type). Here,array1andarray2are the samples,tailsspecifies whether it’s a one-tailed (1) or two-tailed (2) test, andtypeindicates the type of T-test (1 for paired, 2 for two-sample equal variances, 3 for two-sample unequal variances). - The function returns the p-value directly, which can then be compared to your chosen significance level (often 0.05) to decide whether to reject the null hypothesis.
Using Analysis ToolPak for P-Value Calculation

Excel’s Analysis ToolPak add-in provides a more straightforward way to perform various statistical tests, including calculating p-values.
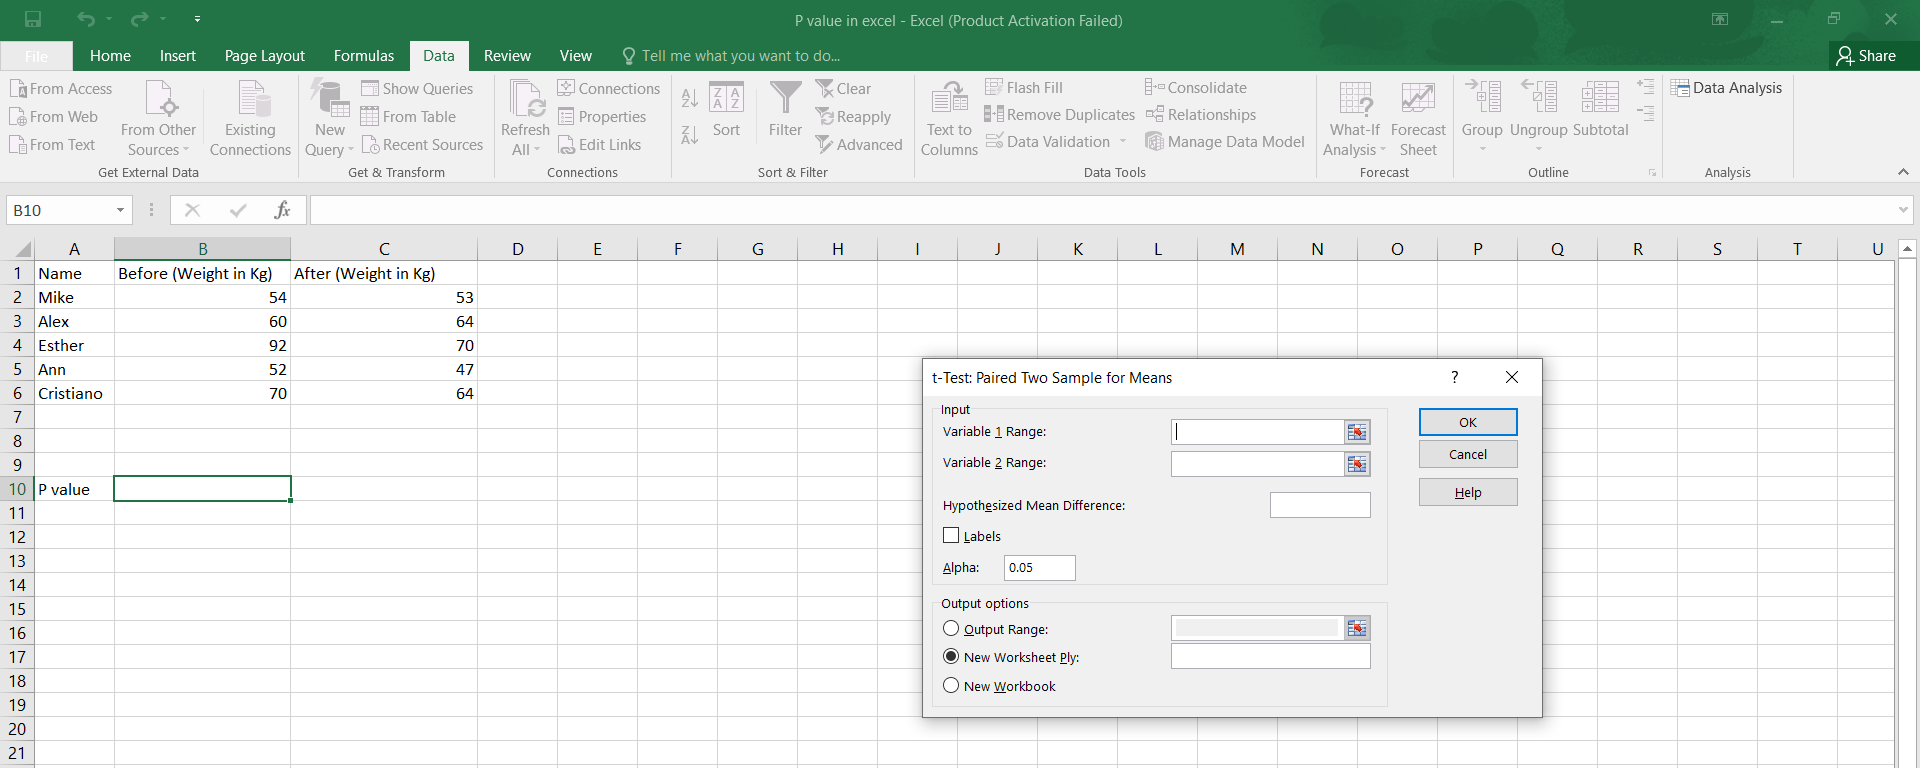
- Activate the Analysis ToolPak by going to
File>Options>Add-ins, then selectAnalysis ToolPakand clickOK. - For a Z-test or T-test, go to
Data>Data Analysis, select the appropriate test, and follow the prompts to input your data and choose options. The output will include the p-value.
Interpreting P-Values

- A small p-value (less than your chosen alpha level, typically 0.05) indicates that the observed data would be very unlikely under the null hypothesis, suggesting that you should reject the null hypothesis. - A large p-value (greater than your chosen alpha level) indicates that the observed data are consistent with the null hypothesis, suggesting that you should fail to reject the null hypothesis.
📝 Note: The choice of alpha level (significance level) depends on the context of your research and the acceptable risk of Type I error (rejecting a true null hypothesis).
Conclusion Summarization
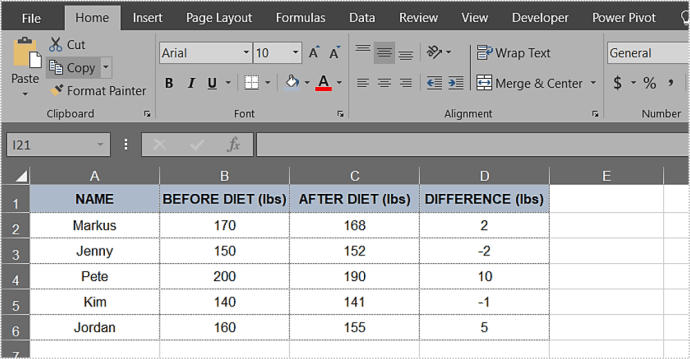
Calculating the p-value in Excel can be efficiently done using built-in functions like
NORM.S.DIST for Z-tests and T.TEST for T-tests, or by utilizing the Analysis ToolPak for a more guided approach. Understanding and correctly interpreting the p-value is crucial for making informed decisions in hypothesis testing. Whether you’re performing a simple Z-test or a more complex statistical analysis, Excel provides the tools necessary to calculate and interpret p-values effectively.
What does a p-value of 0.05 mean?

+
A p-value of 0.05 means that there is a 5% probability of observing the results (or more extreme) assuming that the null hypothesis is true. It’s the threshold for rejecting the null hypothesis in most statistical tests.
How do I choose between a Z-test and a T-test?

+
Choose a Z-test when the population standard deviation is known, and choose a T-test when the population standard deviation is unknown. This decision is crucial because it affects the accuracy of your hypothesis testing.
What is the significance of the Analysis ToolPak in Excel for statistical tests?
+
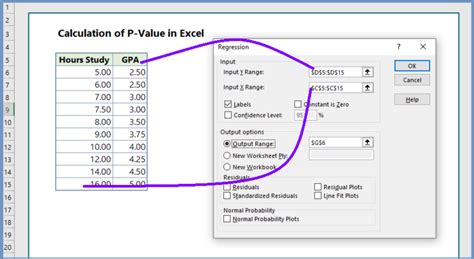
The Analysis ToolPak in Excel provides an easy-to-use interface for performing various statistical tests, including those for calculating p-values. It simplifies the process by guiding the user through the input of data and selection of test parameters.
