Compute P Value In Excel Easily
Introduction to Computing P-Value in Excel
When working with statistical data, understanding the significance of your results is crucial. One key metric in determining this significance is the p-value. The p-value, or probability value, tells you how likely it is to observe your results (or more extreme) assuming that the null hypothesis is true. In this guide, we will walk through the process of computing the p-value in Excel, a powerful tool for data analysis.
Understanding P-Value
Before diving into the computation, it’s essential to grasp what a p-value represents. The p-value is a number between 0 and 1 that indicates the strength of evidence against a null hypothesis. A small p-value (typically less than 0.05) suggests that the observed data would be very unlikely under the null hypothesis, leading to the rejection of the null hypothesis. On the other hand, a large p-value suggests that the data are consistent with the null hypothesis, and thus, you fail to reject it.
Steps to Compute P-Value in Excel
Computing the p-value in Excel can be straightforward for certain types of tests, thanks to built-in functions. Here’s how you can do it for a few common scenarios:
For a Z-Test
- Formulate your null and alternative hypotheses.
- Calculate the Z-score using the formula: Z = (X - μ) / (σ / √n), where X is the sample mean, μ is the population mean, σ is the population standard deviation, and n is the sample size.
- Use the Z SCORE function in Excel to find the Z-score if you prefer a formulaic approach.
- Look up the p-value using the Z-score. Excel provides the
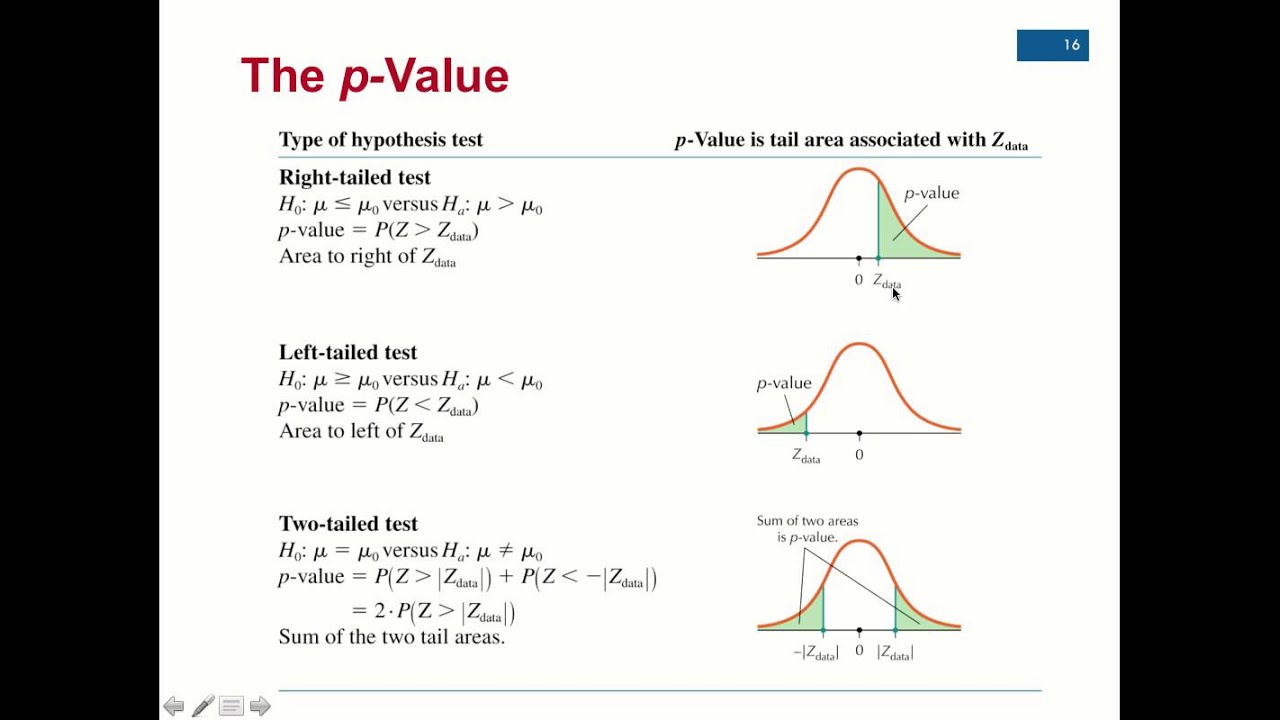
NORM.S.DISTfunction for this purpose, which gives the probability that a standard normal variable is less than or equal to a given value. The syntax isNORM.S.DIST(z, cumulative). Settingcumulativeto TRUE gives you the area to the left of the Z-score, which is the p-value for a one-tailed test if your Z-score is positive (or the p-value for the opposite tail if your Z-score is negative).
For a T-Test
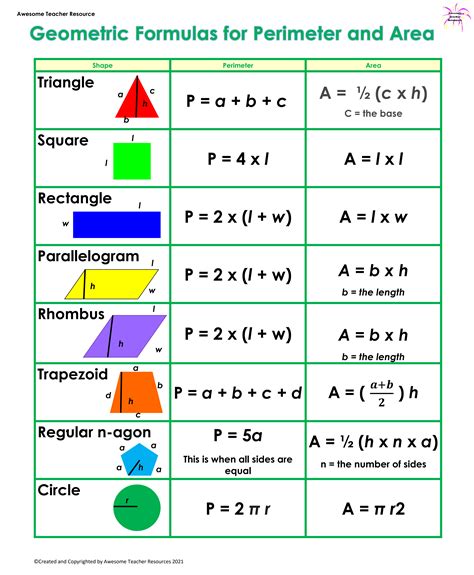
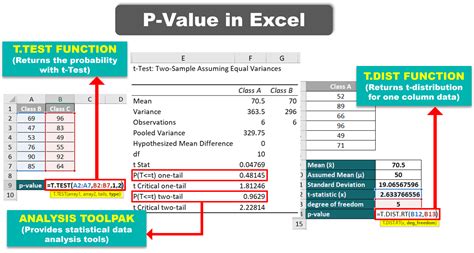
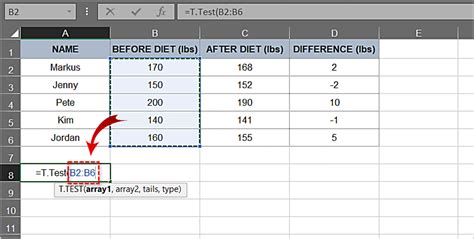
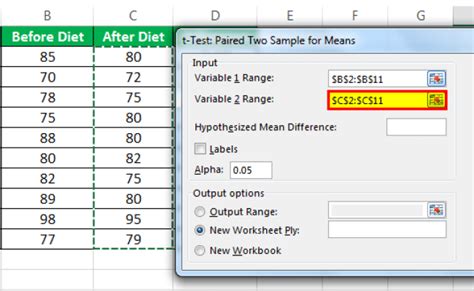
- Use the T.TEST function for paired or unpaired samples. The syntax varies depending on whether you’re doing a paired or unpaired test:
- For paired samples:
T.TEST(array1, array2, tails, type), wherearray1andarray2are the ranges of the two samples,tailsspecifies whether it’s a one-tailed or two-tailed test, andtypespecifies the type of test (1 for paired). - For unpaired samples with equal variances:
T.TEST(array1, array2, tails, type), wheretypeis 2 for a homoscedastic (equal variances) two-sample t-test.
- For paired samples:
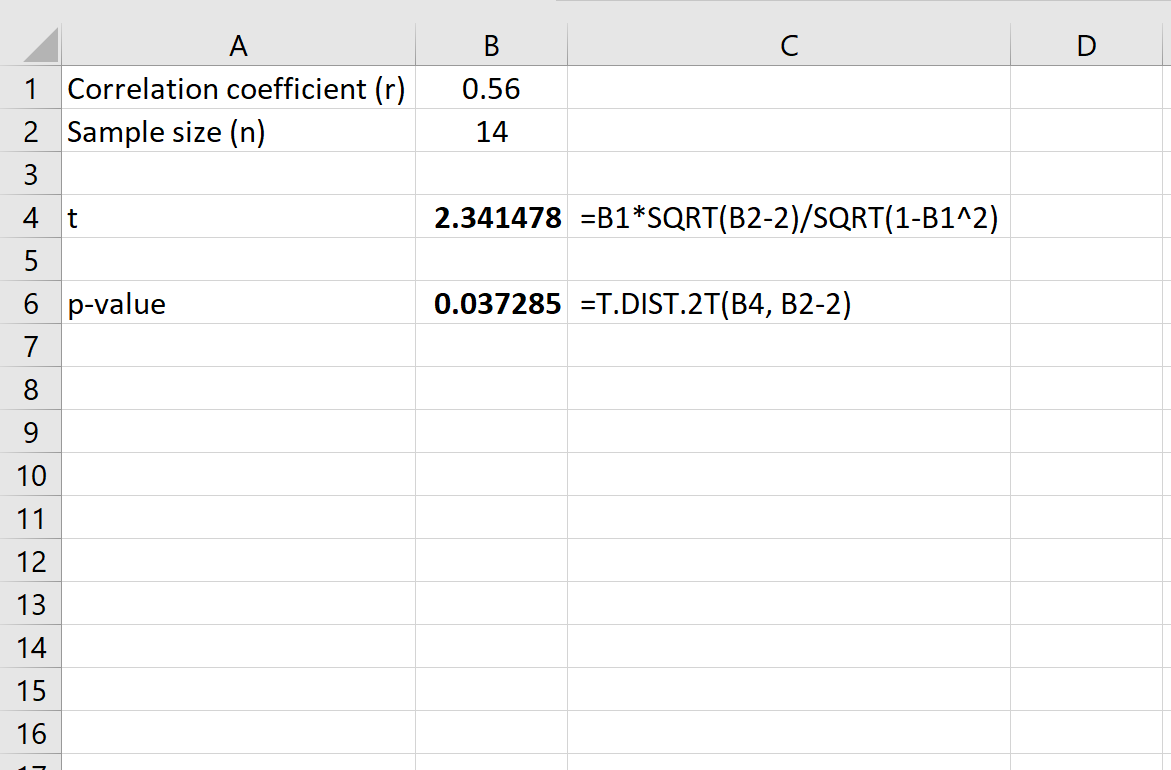
- Excel returns the p-value directly from the T.TEST function, making it straightforward to interpret your results.
Example Calculation
Let’s consider an example of a Z-test. Suppose we have a sample mean (X) of 85, a known population mean (μ) of 80, a population standard deviation (σ) of 10, and a sample size (n) of 100.
- Calculate the Z-score: Z = (85 - 80) / (10 / √100) = 5 / 1 = 5.
- Use the
NORM.S.DISTfunction to find the p-value:NORM.S.DIST(5, TRUE).
The result will give you the p-value for a one-tailed test. Since the Z-score is 5, which is far to the right on the standard normal distribution curve, the p-value will be very close to 1 for the area to the left of the Z-score, but since we’re looking at the right tail (given our Z-score is positive and we’re interested in the probability of observing a value at least as extreme as our sample mean), we actually want to look at the area to the right of the Z-score for a one-tailed test, which would be 1 - NORM.S.DIST(5, TRUE).
For a two-tailed test, you would consider both tails of the distribution, so you’d double the p-value obtained from looking at just one tail.
Interpreting P-Values

- P-value ≤ 0.05: Typically considered statistically significant, leading to the rejection of the null hypothesis. - P-value > 0.05: Considered not statistically significant, failing to reject the null hypothesis.
📝 Note: The choice of significance level (commonly 0.05) depends on the context and the trade-off between Type I and Type II errors.
Conclusion and Future Directions

Computing the p-value in Excel is a straightforward process for various statistical tests, including Z-tests and T-tests. Understanding what p-values represent and how to interpret them is crucial for making informed decisions based on statistical analysis. As you delve deeper into statistical analysis, exploring more advanced techniques and understanding the assumptions behind different tests will be essential for accurate and meaningful interpretation of your data.
What does a p-value of 0.01 indicate?
+
A p-value of 0.01 indicates that there is only a 1% chance of observing the results (or more extreme) if the null hypothesis is true, suggesting strong evidence against the null hypothesis.
How do I choose between a one-tailed and two-tailed test?
+
The choice between a one-tailed and two-tailed test depends on your research question and hypotheses. A one-tailed test is used when you have a specific direction of effect in mind (e.g., you predict an increase), while a two-tailed test is used when you’re interested in any difference (increase or decrease) from the null hypothesis value.
Can I use Excel for complex statistical analyses?

+
While Excel is versatile and can handle many statistical tasks, including hypothesis testing and regression analysis, it may not be the best tool for very complex analyses or large datasets. Specialized statistical software like R or SPSS might be more appropriate for advanced analyses.
