Anova In Excel Made Easy
Introduction to Anova in Excel
Analysis of Variance, commonly referred to as Anova, is a statistical technique used to compare means of two or more samples to find out if at least one of the means is different. It is a powerful tool in data analysis, helping researchers and analysts understand the variability within and between groups. Excel, being one of the most widely used spreadsheet programs, offers an easy way to perform Anova through its Analysis ToolPak add-in. This guide will walk you through the steps of performing Anova in Excel, explaining the process in detail, and highlighting key considerations for effective analysis.
Understanding Anova
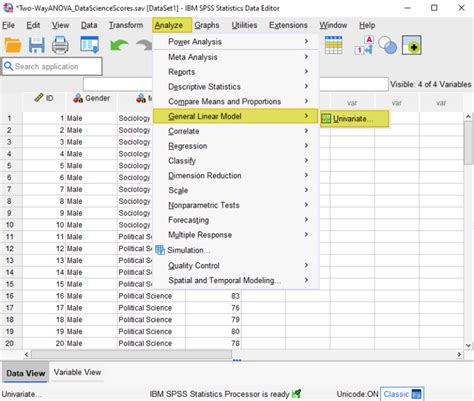
Before diving into the process of performing Anova in Excel, it’s essential to understand the basics of Anova. There are several types of Anova, including: - One-way Anova: Compares the means of three or more samples to find out if at least one of the means is different. - Two-way Anova: Examines the effects of two independent variables on a continuous outcome variable. - N-way Anova: Involves more than two independent variables.
Each type of Anova serves a different purpose and is used based on the research question and data structure.
Preparing Data for Anova in Excel
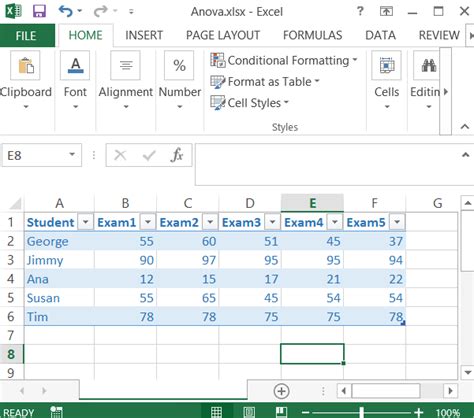
To perform Anova in Excel, your data needs to be organized in a specific way. Here are the steps to prepare your data: - Ensure your data is in a table format with each sample or group in a separate column. - The data should be continuous (not categorical). - Check for normality and equal variances among the groups, as these are assumptions of Anova. You can use tools like the Shapiro-Wilk test for normality and Levene’s test for homogeneity of variances.
Enabling the Analysis ToolPak in Excel
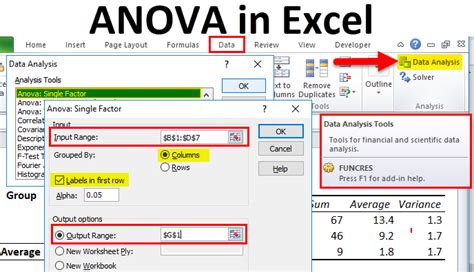
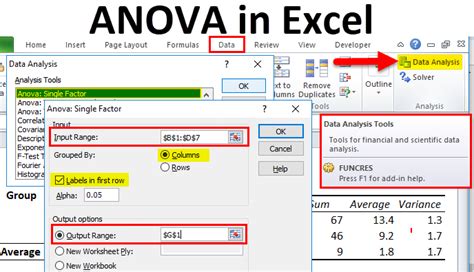
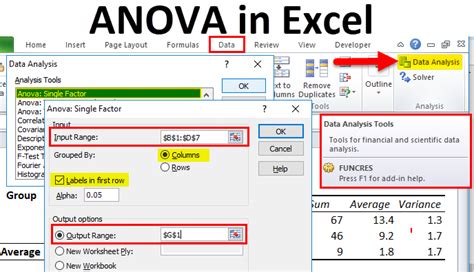
The Analysis ToolPak is an Excel add-in that provides statistical analysis tools, including Anova. To enable it: - Go to File > Options > Add-ins. - Select Analysis ToolPak and click OK. - If you don’t see Analysis ToolPak in the list, you might need to browse for it.
Performing Anova in Excel
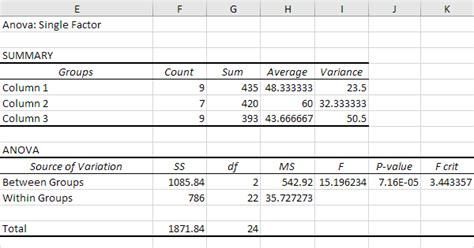
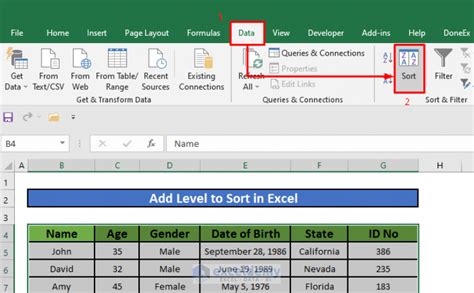
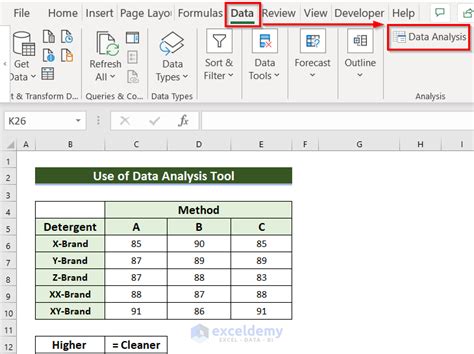
With the Analysis ToolPak enabled, you can now perform Anova: - Select the range of cells that contains your data. - Go to the Data tab > Data Analysis > Anova: Single Factor (for one-way Anova). - Click OK and select the output range. - Click OK to run the Anova.
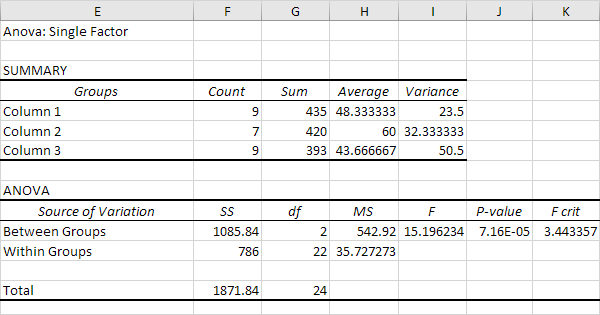
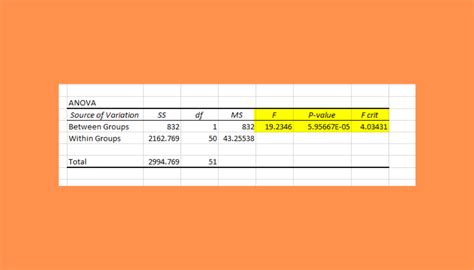
The output will include the Anova table, which shows the F-statistic, p-value, and other relevant statistics. The p-value is crucial; if it’s less than your chosen significance level (commonly 0.05), you reject the null hypothesis, indicating that at least one of the means is different.
Interpreting Anova Results

Interpreting the results of Anova involves understanding the components of the Anova table: - F-statistic: A ratio of the variance between groups to the variance within groups. - p-value: Indicates the probability of observing the test results assuming that the null hypothesis is true. - DF between groups and DF within groups: Degrees of freedom for between and within group variations.
If the p-value is significant, it suggests that there is a significant difference between the means of the groups. However, Anova does not tell you which specific groups are different, only that at least one group is different from the others. For multiple comparisons, you might need to use post-hoc tests like the Tukey HSD test.
Common Challenges and Solutions

- Non-normality and unequal variances: Consider transforming your data or using alternative tests like the Kruskal-Wallis H-test for non-parametric data. - Missing data: Decide on an appropriate method for handling missing values, such as listwise deletion or imputation.
💡 Note: Always check the assumptions of Anova before interpreting the results, and consider consulting with a statistician for complex analyses.
Conclusion and Final Thoughts
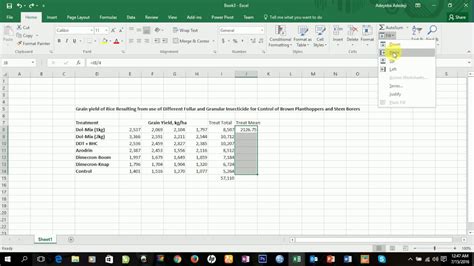
Performing Anova in Excel is a straightforward process once you have your data organized and the Analysis ToolPak enabled. Understanding the results, including the F-statistic and p-value, is crucial for drawing meaningful conclusions from your data. Remember to always check the assumptions of Anova and consider additional analyses, such as post-hoc tests, to further understand the differences between groups. With practice, Anova can become a powerful tool in your data analysis toolkit, helping you uncover insights that might otherwise remain hidden.
What is the purpose of Anova in data analysis?
+
Anova is used to compare means of two or more samples to find out if at least one of the means is different, helping in understanding the variability within and between groups.
How do I enable the Analysis ToolPak in Excel?
+
To enable the Analysis ToolPak, go to File > Options > Add-ins, select Analysis ToolPak, and click OK. If it’s not listed, you may need to browse for it.
What does the p-value in Anova results indicate?
+
The p-value indicates the probability of observing the test results assuming that the null hypothesis is true. A p-value less than 0.05 typically leads to the rejection of the null hypothesis, suggesting that at least one of the means is different.
