5 Ways To Calculate MAD

Introduction to Mean Absolute Deviation (MAD)

The Mean Absolute Deviation (MAD) is a measure of the average distance between each data point and the mean of the dataset. It is a way to describe the spread or dispersion of a set of data. Calculating MAD is essential in statistics and data analysis as it gives an idea of how much the individual data points deviate from the central value, which is the mean in this context. MAD is particularly useful because it is less affected by outliers compared to other measures like the standard deviation. In this article, we will explore five ways to calculate MAD, understanding its importance, and how it applies to real-world data analysis.
Understanding the Concept of MAD
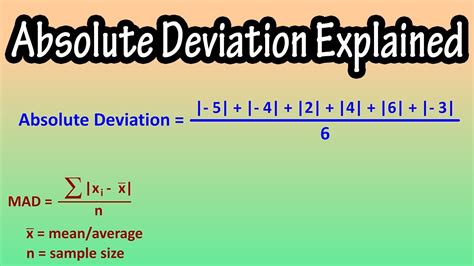
Before diving into the calculation methods, it’s crucial to understand what MAD represents. The Mean Absolute Deviation is calculated by taking the absolute difference between each data point and the mean, summing these differences, and then dividing by the number of observations. This results in a value that indicates the average distance of each data point from the mean. A lower MAD indicates that the data points tend to be close to the mean, while a higher MAD suggests that the data points are spread out over a larger range of values.
5 Ways to Calculate MAD
Calculating MAD can be approached in several ways, each with its own application depending on the dataset and the tools available. Here are five methods to calculate MAD:
1. Manual Calculation
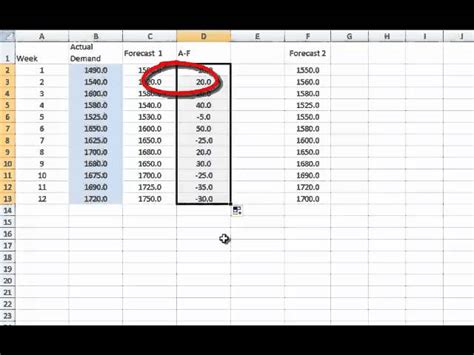
The most straightforward method to calculate MAD is by manually computing the absolute differences of each data point from the mean, summing them up, and then dividing by the total number of data points. This method is feasible for small datasets but becomes impractical for larger sets.
2. Using Excel
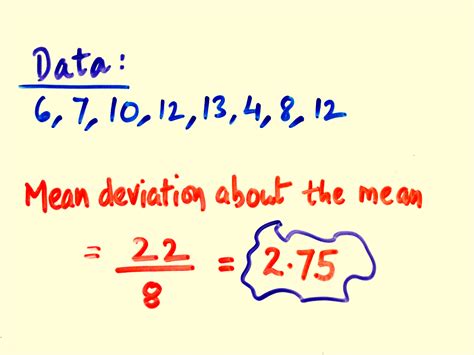
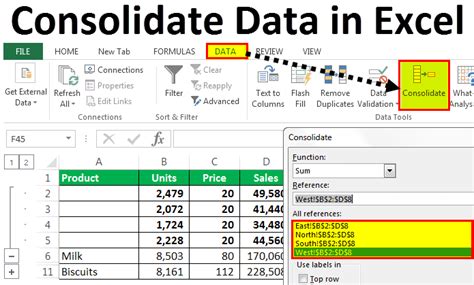
For those familiar with Microsoft Excel, calculating MAD can be simplified using formulas. By first calculating the mean of the dataset and then using the ABS function to find the absolute deviations, you can sum these deviations and divide by the count of the numbers to find the MAD.
3. Python Programming

Python, with its extensive libraries like NumPy and Pandas, offers an efficient way to calculate MAD. By using the numpy.mean() function to calculate the mean and then applying a list comprehension to calculate the absolute deviations, you can easily compute the MAD of a dataset.
4. R Programming

Similar to Python, R is a powerful tool for statistical computing and provides straightforward methods to calculate MAD. The mean() function calculates the mean, and then using the abs() function within a loop or vectorized operation, you can compute the MAD.
5. Statistical Calculators and Software

Many statistical calculators and software packages, including graphing calculators and statistical analysis programs, have built-in functions to calculate MAD directly. These tools can simplify the process, especially for large datasets, by automating the calculation with a few keystrokes or mouse clicks.
Importance of MAD in Data Analysis

MAD is a robust measure of dispersion because it is less sensitive to outliers compared to the standard deviation. This makes it particularly useful in datasets where outliers may significantly skew the results. Understanding and calculating MAD is essential for:
- Data Cleaning: Identifying outliers and understanding their impact on the dataset.
- Comparing Distributions: MAD can be used to compare the spread of different datasets.
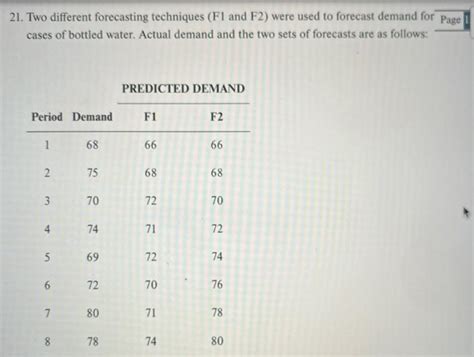
- Forecasting: In some forecasting models, MAD is used as a measure of error.
📝 Note: When dealing with large datasets, automated tools and programming languages like Python or R are preferred for calculating MAD due to their efficiency and accuracy.
Real-World Applications of MAD
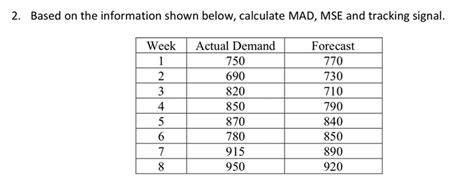
MAD has various real-world applications, including: - Finance: To measure the volatility of stock prices or portfolio performance. - Quality Control: In manufacturing, MAD can be used to monitor the consistency of product quality. - Weather Forecasting: To measure the average difference between forecasted and actual weather conditions.
| Method | Description | Application |
|---|---|---|
| Manual Calculation | Manual computation of absolute differences from the mean. | Small datasets. |
| Using Excel | Utilizing Excel formulas for calculation. | Medium-sized datasets, especially in business settings. |
| Python Programming | Using Python libraries like NumPy and Pandas. | Large datasets, data science applications. |
| R Programming | Using R for statistical computing. | Statistical analysis, research. |
| Statistical Calculators and Software | Using built-in functions in calculators or software. | Quick analysis, educational purposes. |
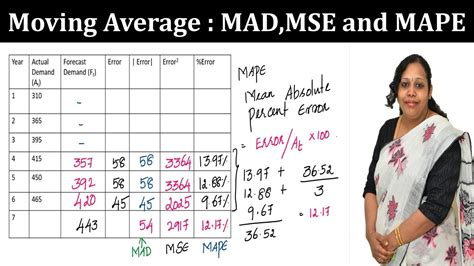
To summarize, calculating the Mean Absolute Deviation (MAD) is a fundamental aspect of understanding the spread of a dataset. With various methods available, from manual calculations to using sophisticated programming languages and software, MAD can be applied in numerous fields to provide insights into data dispersion and variability. Whether it’s for educational purposes, data analysis, or real-world applications, understanding how to calculate MAD and interpret its results is essential for making informed decisions based on data.
What is the primary use of MAD in statistics?

+
The primary use of MAD is to measure the average distance between each data point and the mean of the dataset, providing a measure of dispersion that is less affected by outliers compared to the standard deviation.
How does MAD differ from standard deviation?

+
MAD and standard deviation both measure dispersion, but MAD is less sensitive to outliers because it uses absolute values rather than squared differences, making it a more robust measure for datasets with extreme values.
What are some common applications of MAD in real-world scenarios?
+
MAD has applications in finance to measure volatility, in quality control to monitor product consistency, and in weather forecasting to evaluate the accuracy of forecasts, among other uses.
