Calculate Frequency in Excel
Introduction to Calculating Frequency in Excel
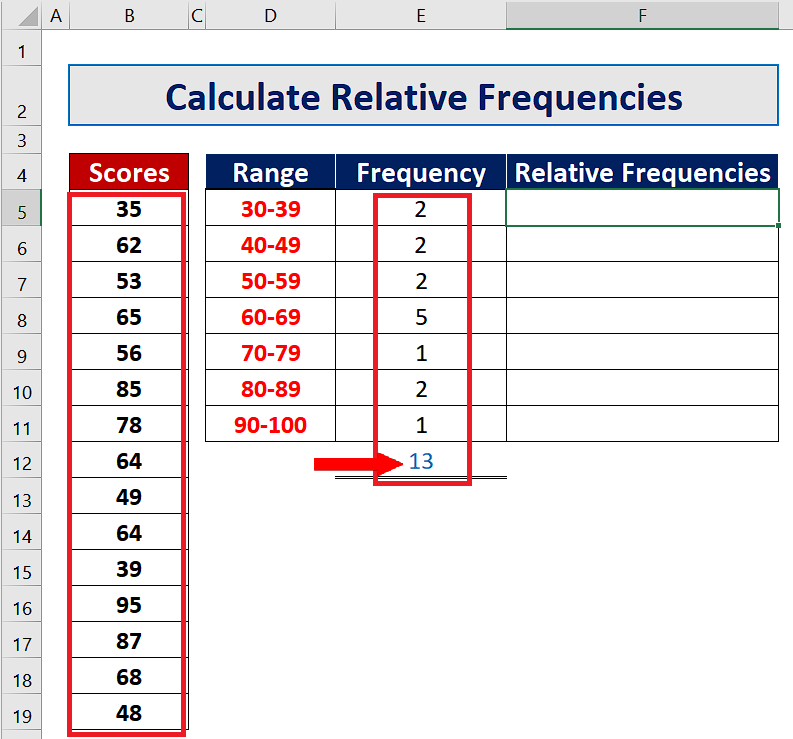
Calculating frequency in Excel is a common task that involves determining how often a specific value or range of values occurs within a dataset. This can be useful in various applications, such as data analysis, statistical modeling, and business intelligence. In this article, we will explore the different methods for calculating frequency in Excel, including using formulas, functions, and pivot tables.
Using Formulas to Calculate Frequency

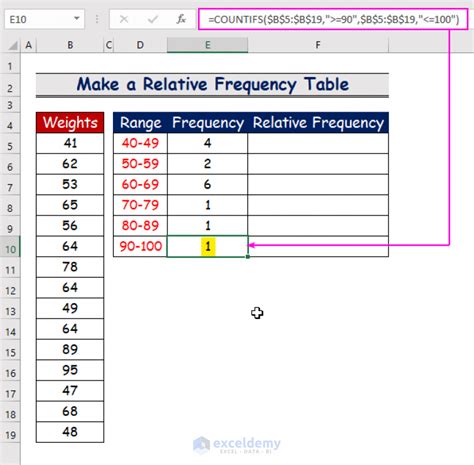
One way to calculate frequency in Excel is by using formulas. The most common formula used for this purpose is the COUNTIF function, which counts the number of cells in a range that meet a specified condition. The syntax for the COUNTIF function is:
COUNTIF(range, criteria)
Where: - range is the range of cells that you want to count. - criteria is the condition that you want to apply to the range.
For example, if you want to count the number of cells in the range A1:A10 that contain the value “Yes”, you can use the following formula:
=COUNTIF(A1:A10, “Yes”)
Using Functions to Calculate Frequency
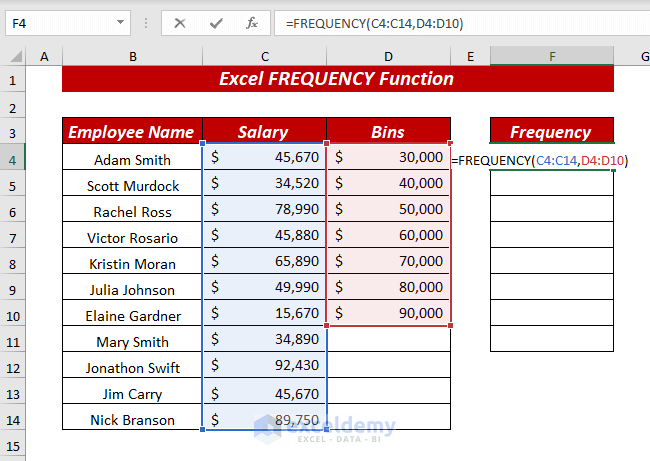
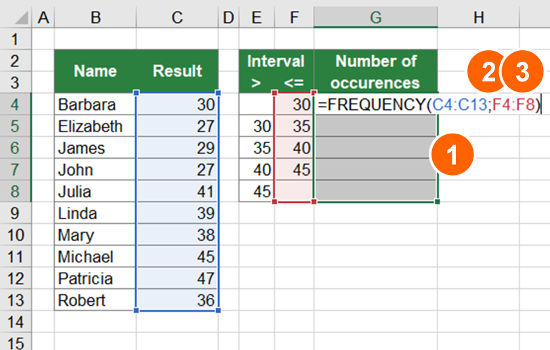
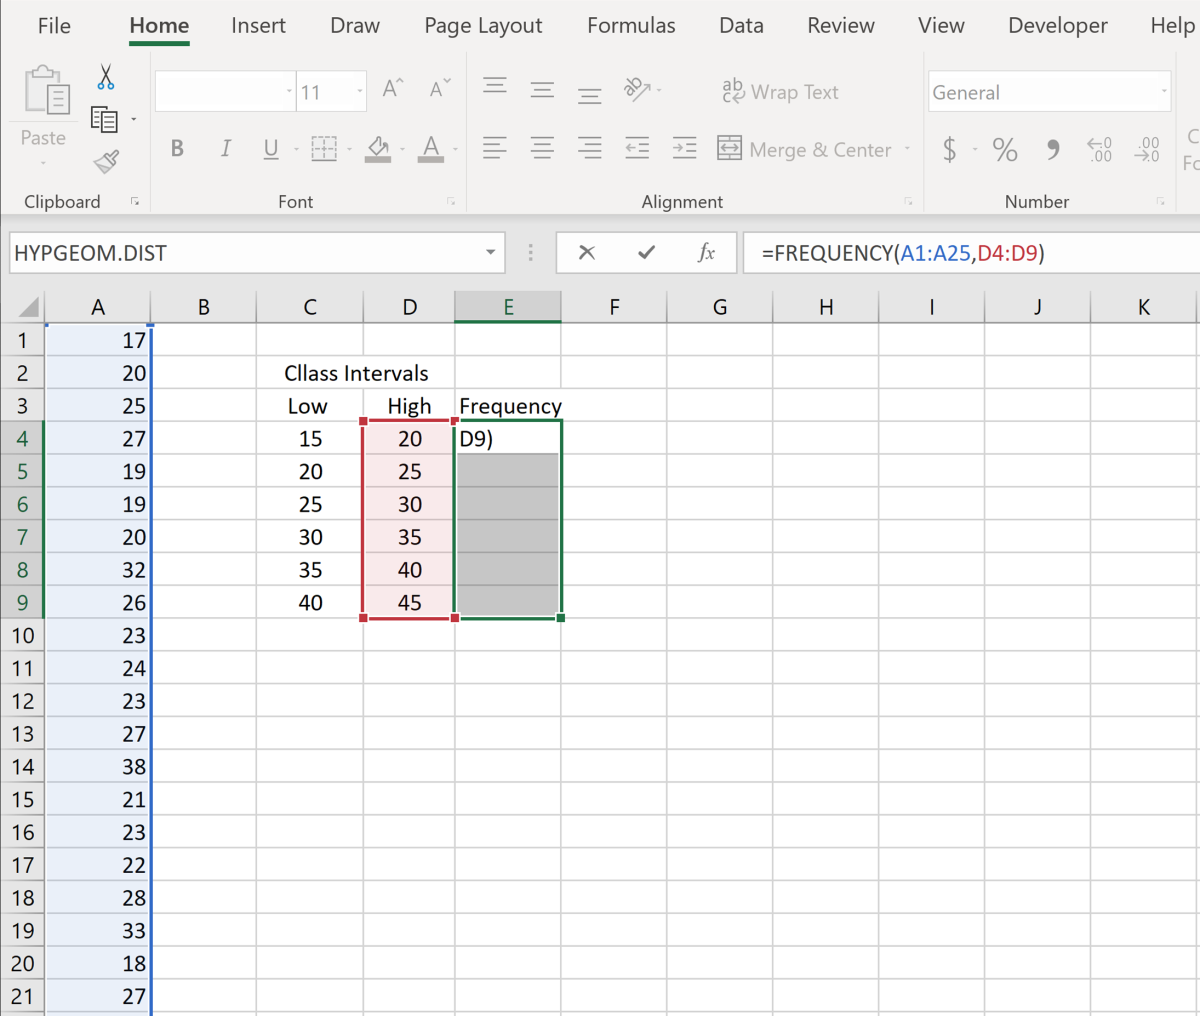
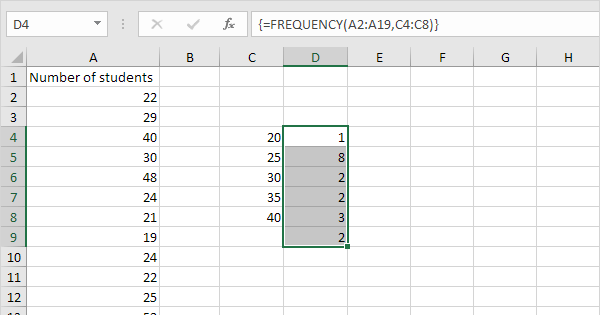
Another way to calculate frequency in Excel is by using the FREQUENCY function. This function returns a frequency distribution of a dataset, which shows the number of occurrences of each value in the dataset. The syntax for the FREQUENCY function is:
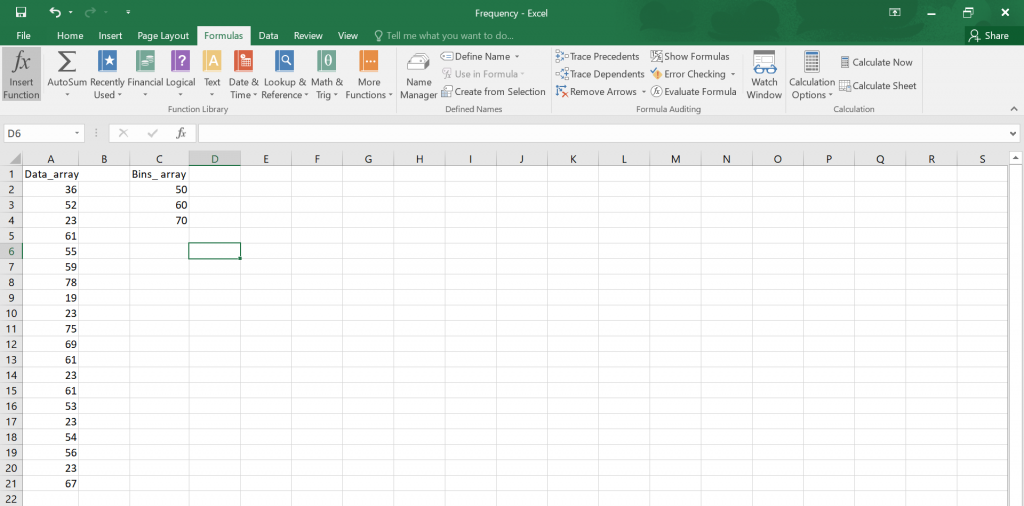
FREQUENCY(data_array, bins_array)
Where: - data_array is the range of cells that contains the dataset. - bins_array is the range of cells that contains the bins (or intervals) that you want to use to categorize the data.
For example, if you want to calculate the frequency of the values in the range A1:A10, you can use the following formula:
=FREQUENCY(A1:A10, B1:B5)
Assuming the bins are in the range B1:B5.
Using Pivot Tables to Calculate Frequency
Pivot tables are a powerful tool in Excel that can be used to calculate frequency. To create a pivot table, follow these steps:
- Select the range of cells that contains the dataset.
- Go to the “Insert” tab in the ribbon and click on “PivotTable”.
- Choose a cell to place the pivot table and click “OK”.
- Drag the field that you want to calculate the frequency for to the “Row Labels” area.
- Right-click on the field and select “Value Field Settings”.
- Select “Count” as the value field and click “OK”.
The pivot table will display the frequency of each value in the dataset.
Example of Calculating Frequency
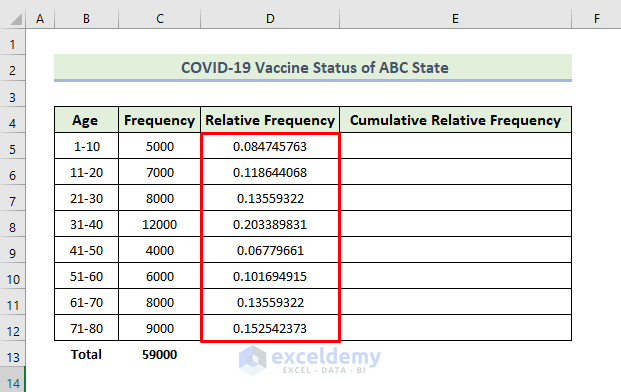
Suppose we have a dataset of exam scores for a class of students, and we want to calculate the frequency of each score. The dataset is as follows:
| Score |
|---|
| 80 |
| 70 |
| 90 |
| 80 |
| 70 |
| 90 |
| 80 |
| 70 |
| 90 |
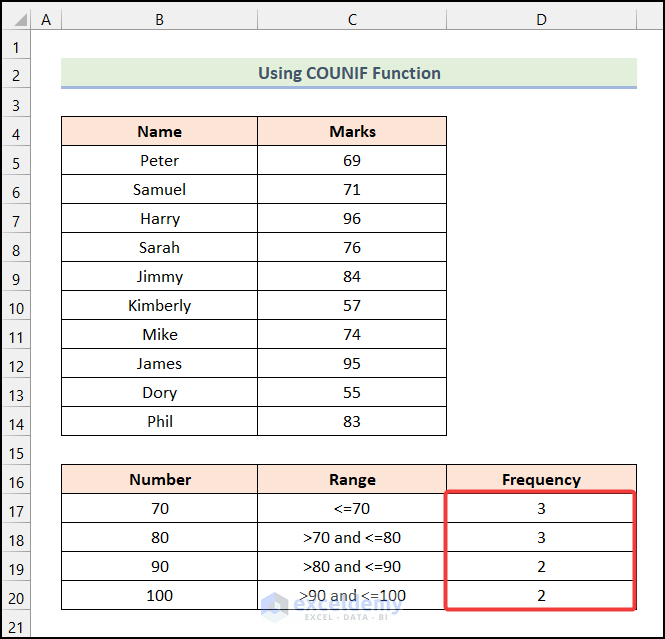
To calculate the frequency of each score, we can use the FREQUENCY function or create a pivot table. The result will be:
| Score | Frequency |
|---|---|
| 70 | 3 |
| 80 | 3 |
| 90 | 4 |
As we can see, the score 70 occurs 3 times, the score 80 occurs 3 times, and the score 90 occurs 4 times.
📝 Note: The FREQUENCY function and pivot tables can be used to calculate frequency for both discrete and continuous data.
To summarize, calculating frequency in Excel can be done using formulas, functions, or pivot tables. The method you choose will depend on the nature of your data and the level of detail you need.
In the final analysis, understanding how to calculate frequency in Excel is a valuable skill that can help you to analyze and interpret data more effectively. By mastering the techniques outlined in this article, you will be able to gain deeper insights into your data and make more informed decisions.
What is the difference between the COUNTIF and FREQUENCY functions in Excel?
+
The COUNTIF function counts the number of cells in a range that meet a specified condition, while the FREQUENCY function returns a frequency distribution of a dataset.
How do I create a pivot table in Excel to calculate frequency?
+
To create a pivot table, select the range of cells that contains the dataset, go to the “Insert” tab, and click on “PivotTable”. Then, drag the field that you want to calculate the frequency for to the “Row Labels” area and right-click to select “Value Field Settings”. Finally, select “Count” as the value field.
Can I use the FREQUENCY function for continuous data?
+
Yes, the FREQUENCY function can be used for both discrete and continuous data. However, for continuous data, you will need to specify the bins or intervals that you want to use to categorize the data.
