Run Anova In Excel
Introduction to ANOVA in Excel
Analyzing data is a crucial part of understanding trends, patterns, and relationships within datasets. One powerful statistical tool used for this purpose is the Analysis of Variance (ANOVA). ANOVA is a statistical technique that is used to compare means of three or more samples to find out if at least one of the means is different. In this blog post, we will explore how to run ANOVA in Excel, a widely used spreadsheet program that offers a range of statistical analysis tools, including ANOVA.
Understanding ANOVA
Before diving into the process of running ANOVA in Excel, it’s essential to understand what ANOVA does. ANOVA is used to determine if there are any statistically significant differences between the means of two or more groups. It helps in understanding if the differences between the groups are due to chance or if they are statistically significant. ANOVA assumes that the data is normally distributed and that the variance across the groups is equal.
Preparing Data for ANOVA in Excel

To run ANOVA in Excel, your data needs to be structured in a specific way. Each group or sample that you want to compare should be in a separate column. For example, if you are comparing the average scores of students from three different schools, each school’s scores should be in its own column. Ensure that your data does not contain any blank cells, as this can affect the analysis.
Running ANOVA in Excel
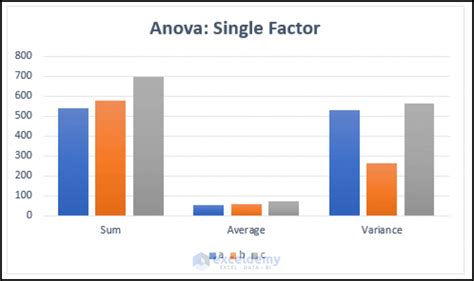
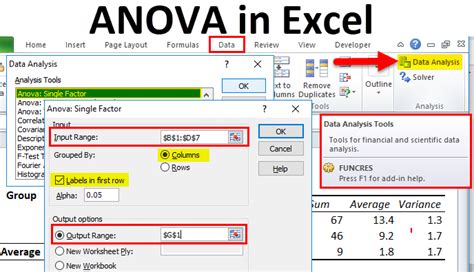
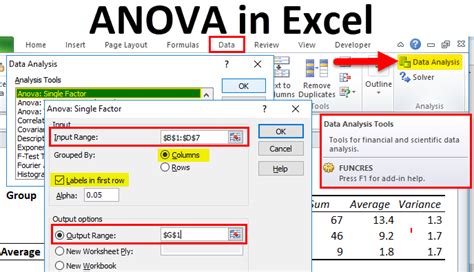
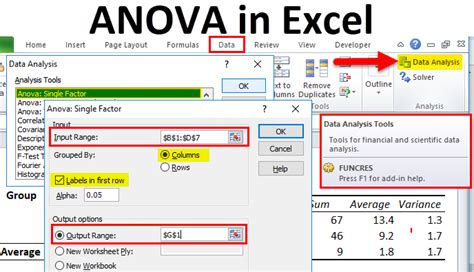
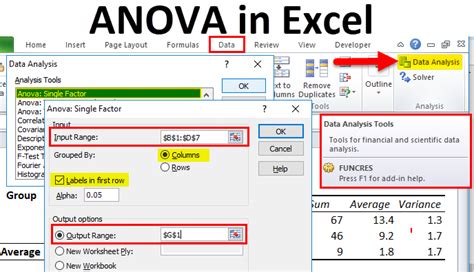
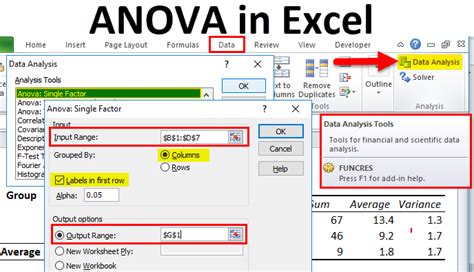
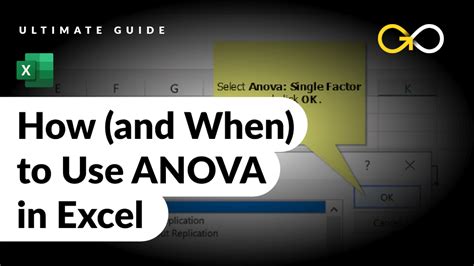
Excel provides a built-in tool for running ANOVA through its “Data Analysis” add-in. If you don’t see the “Data Analysis” option under the “Data” tab, you might need to activate it through the “Add-ins” section in Excel’s settings. Here are the steps to follow: - Go to the “Data” tab. - Click on “Data Analysis” in the “Analysis” group. - Select “Anova: Single Factor” from the list of tools. - Click “OK”. - In the “Anova: Single Factor” dialog box, select the range of cells that contain your data. Make sure to include the headers if you want them to be part of the analysis. - Choose whether you want the analysis to be based on columns or rows, depending on how your data is structured. - Decide on an alpha level. The alpha level is the threshold for determining statistical significance. Commonly, an alpha level of 0.05 is used. - Click “OK” to run the ANOVA.
Interpreting ANOVA Results in Excel
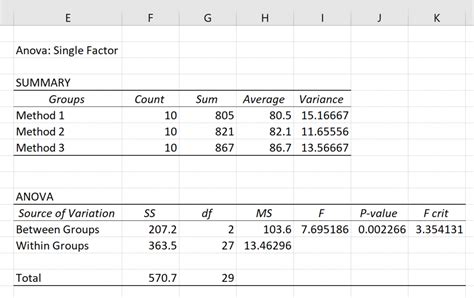
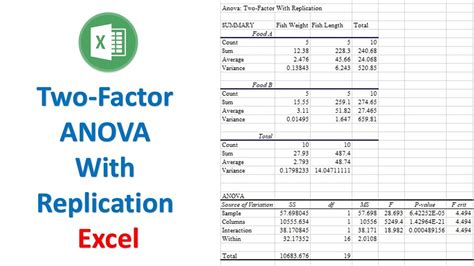
After running ANOVA, Excel will produce an output that includes several statistics. The key statistics to look at are: - F: This is the F-statistic, which is used to determine if the variance between the groups is significantly different from the variance within the groups. - P-value: This indicates the probability of observing the results (or more extreme) if the null hypothesis is true. If the P-value is less than your chosen alpha level (e.g., 0.05), you reject the null hypothesis, indicating that at least one of the means is statistically significantly different from the others.
Tips for Running ANOVA in Excel
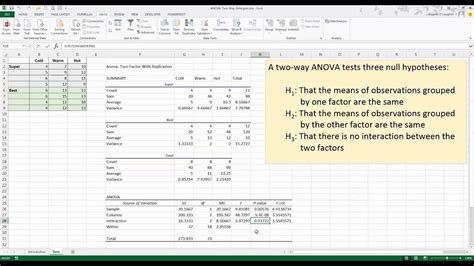
- Check assumptions: ANOVA assumes normality and equal variances. You can check for normality using the Shapiro-Wilk test and for equal variances using the Levene’s test. - Use the right type of ANOVA: Excel offers “Anova: Single Factor” and “Anova: Two-Factor With Replication” among others. Choose the one that best fits your research question. - Understand the limitations: ANOVA tells you if there are differences between groups but does not specify which groups differ. For this, you would need to perform post-hoc tests.
📝 Note: Always validate your data and the assumptions of ANOVA before drawing conclusions from the analysis results.
Conclusion and Future Steps
Running ANOVA in Excel is a straightforward process that can provide valuable insights into the differences between groups within your dataset. By understanding and interpreting the results correctly, you can make informed decisions based on data analysis. Remember to always consider the assumptions of ANOVA and the limitations of the analysis. For more complex analyses or to further explore the differences between specific groups, consider using additional statistical tests or consulting with a statistician.
What is the purpose of ANOVA in data analysis?
+
ANOVA is used to compare means of three or more samples to find out if at least one of the means is different, helping in understanding if the differences between groups are due to chance or are statistically significant.
How do I choose the right type of ANOVA for my data?
+
The choice of ANOVA type depends on your research question and the structure of your data. For example, if you are comparing more than two groups based on one factor, “Anova: Single Factor” might be appropriate. Always consider the assumptions and the specific requirements of each ANOVA type.
What are the key statistics to look at when interpreting ANOVA results?
+
The key statistics include the F-statistic, which indicates the ratio of the variance between groups to the variance within groups, and the P-value, which indicates the probability of observing the results if the null hypothesis is true.

