Get Frequency In Excel
Introduction to Getting Frequency in Excel
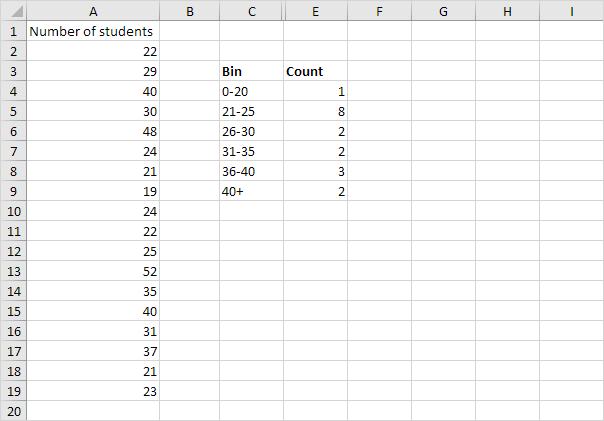
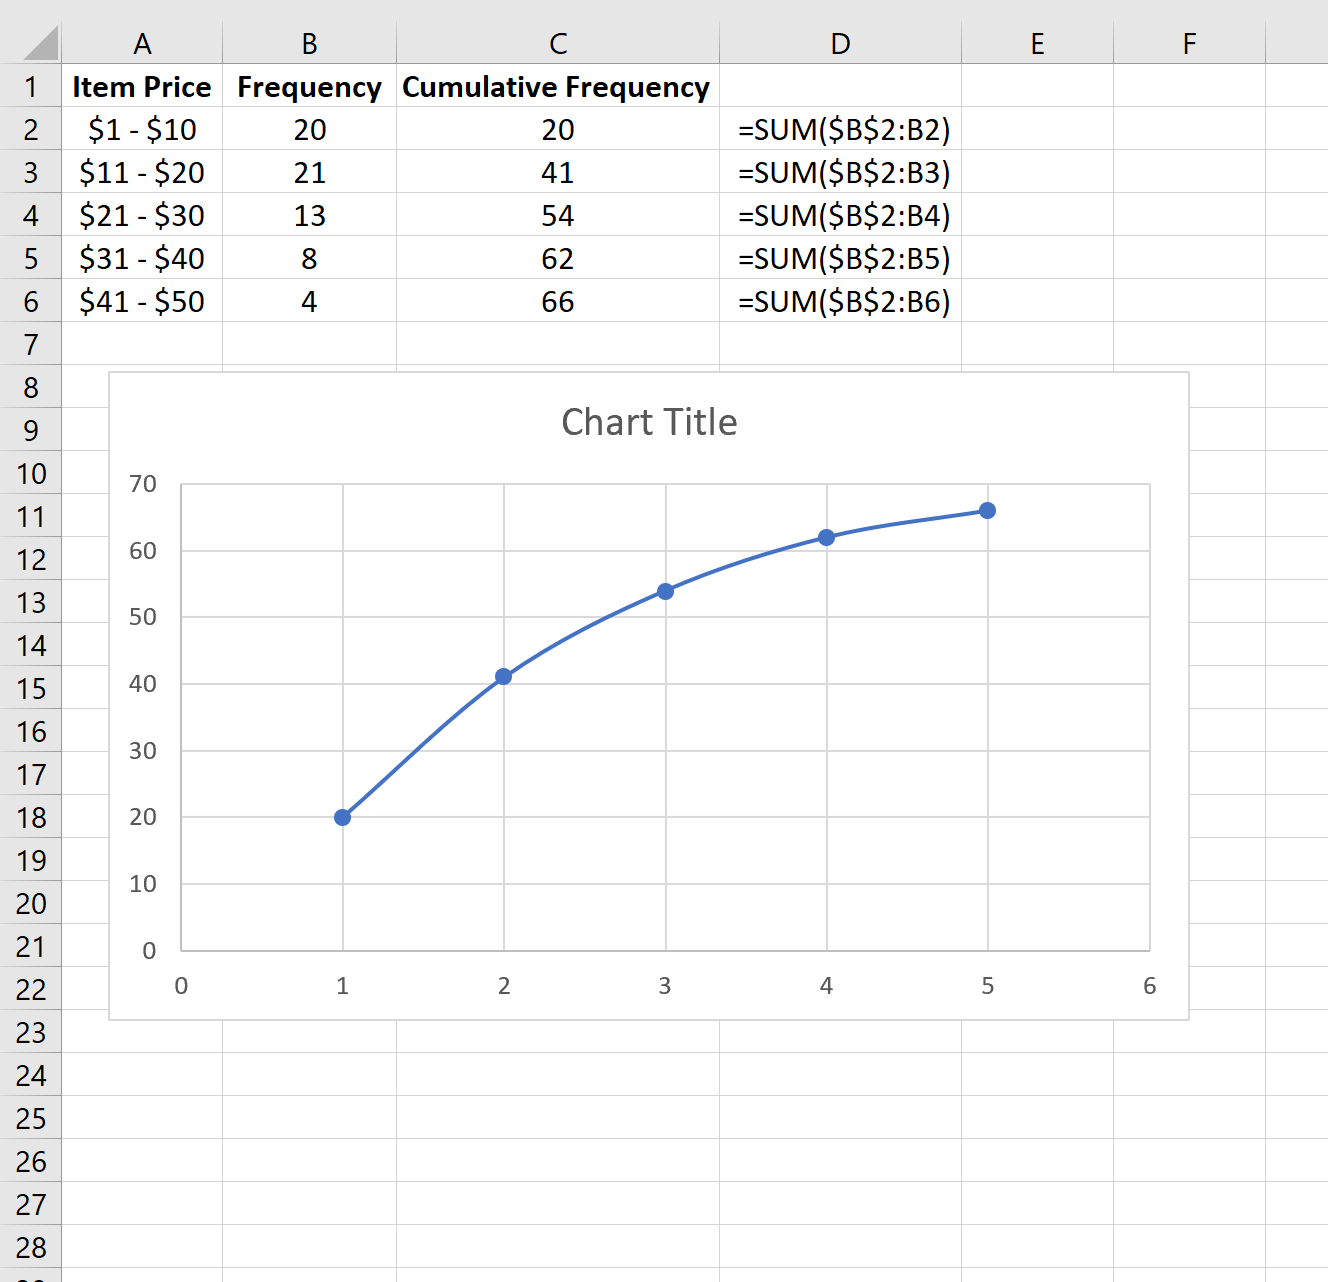
To analyze data in Excel, understanding the frequency of certain values or ranges is crucial. Excel provides several methods to calculate frequency, including using formulas, pivot tables, and the Analysis ToolPak. In this article, we’ll explore how to get frequency in Excel using different approaches, highlighting their applications and benefits.
Method 1: Using the FREQUENCY Function
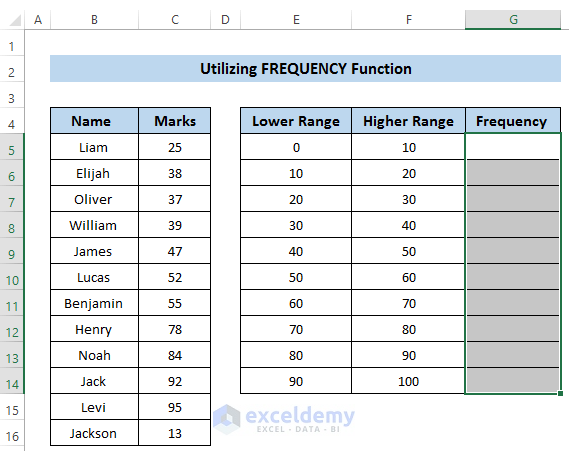
The FREQUENCY function in Excel calculates how often values occur within a range of data. It returns a frequency distribution as an array, which can be useful for understanding the distribution of your data.
To use the FREQUENCY function:
- Select a cell range where you want to display the frequency distribution. This range should have the same number of rows as the bins (categories) you want to create.
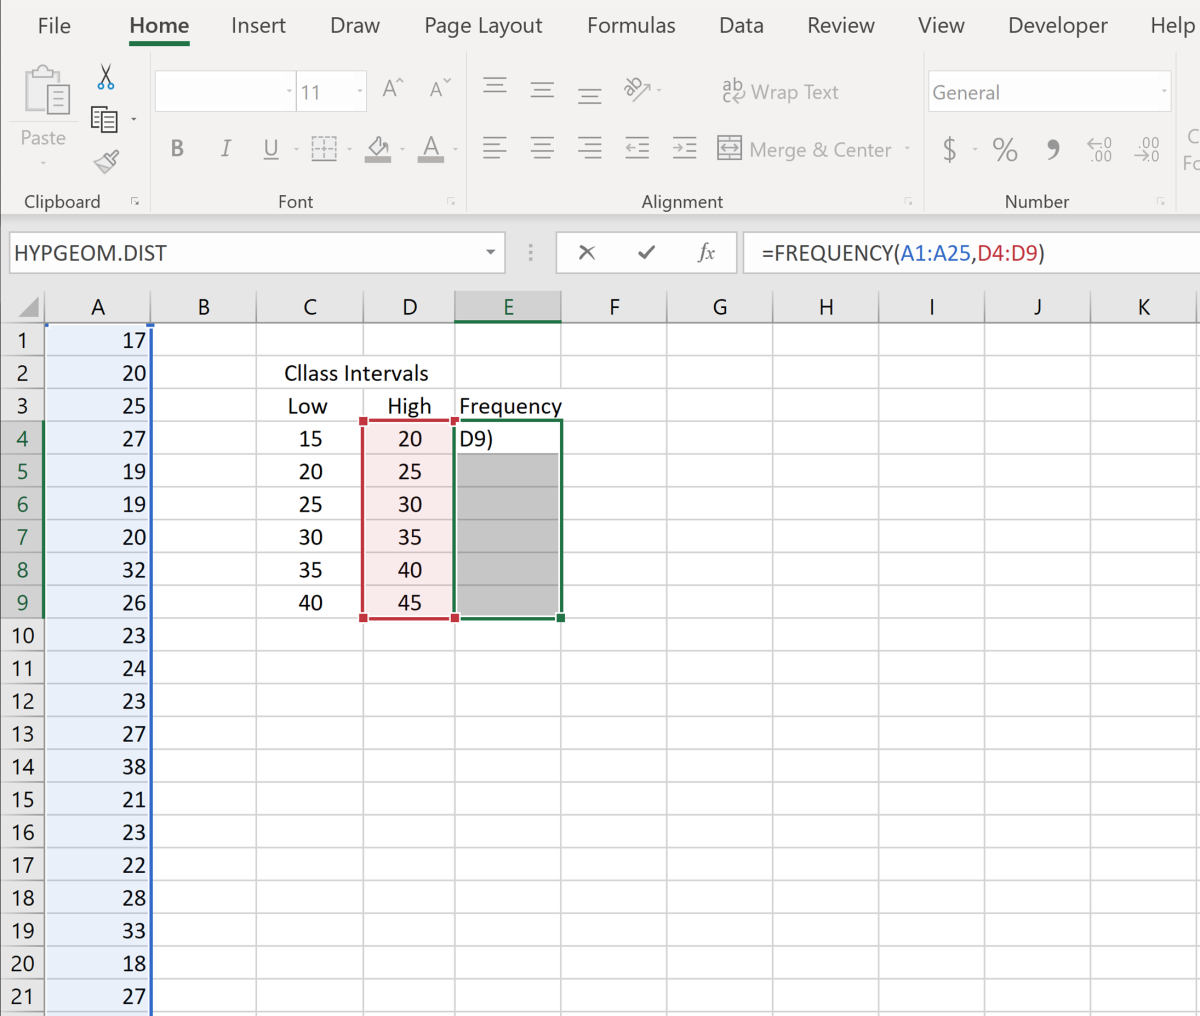
- Type the formula =FREQUENCY(data_array, bins_array), where data_array is the range of cells containing the data you want to analyze, and bins_array is the range of cells containing the bins.
- Press Ctrl+Shift+Enter instead of just Enter, because the FREQUENCY function returns an array.
For example, if your data is in cells A1:A100 and your bins are in cells B1:B10, you would select cells C1:C10, type =FREQUENCY(A1:A100, B1:B10), and then press Ctrl+Shift+Enter.
Method 2: Using Pivot Tables

Pivot tables are a powerful tool in Excel for summarizing and analyzing data. They can easily calculate the frequency of items in a list.
To create a pivot table for frequency: - Select your data range, including headers. - Go to the “Insert” tab in the ribbon and click on “PivotTable”. - Choose a cell to place the pivot table and click OK. - In the PivotTable Fields pane, drag the field you want to analyze to the “Row Labels” area and also to the “Values” area. - Right-click on the field in the “Values” area and select “Value Field Settings”. - In the “Value Field Settings” dialog, change the “Summarize by” option to “Count” to get the frequency.
Method 3: Using the COUNTIF Function

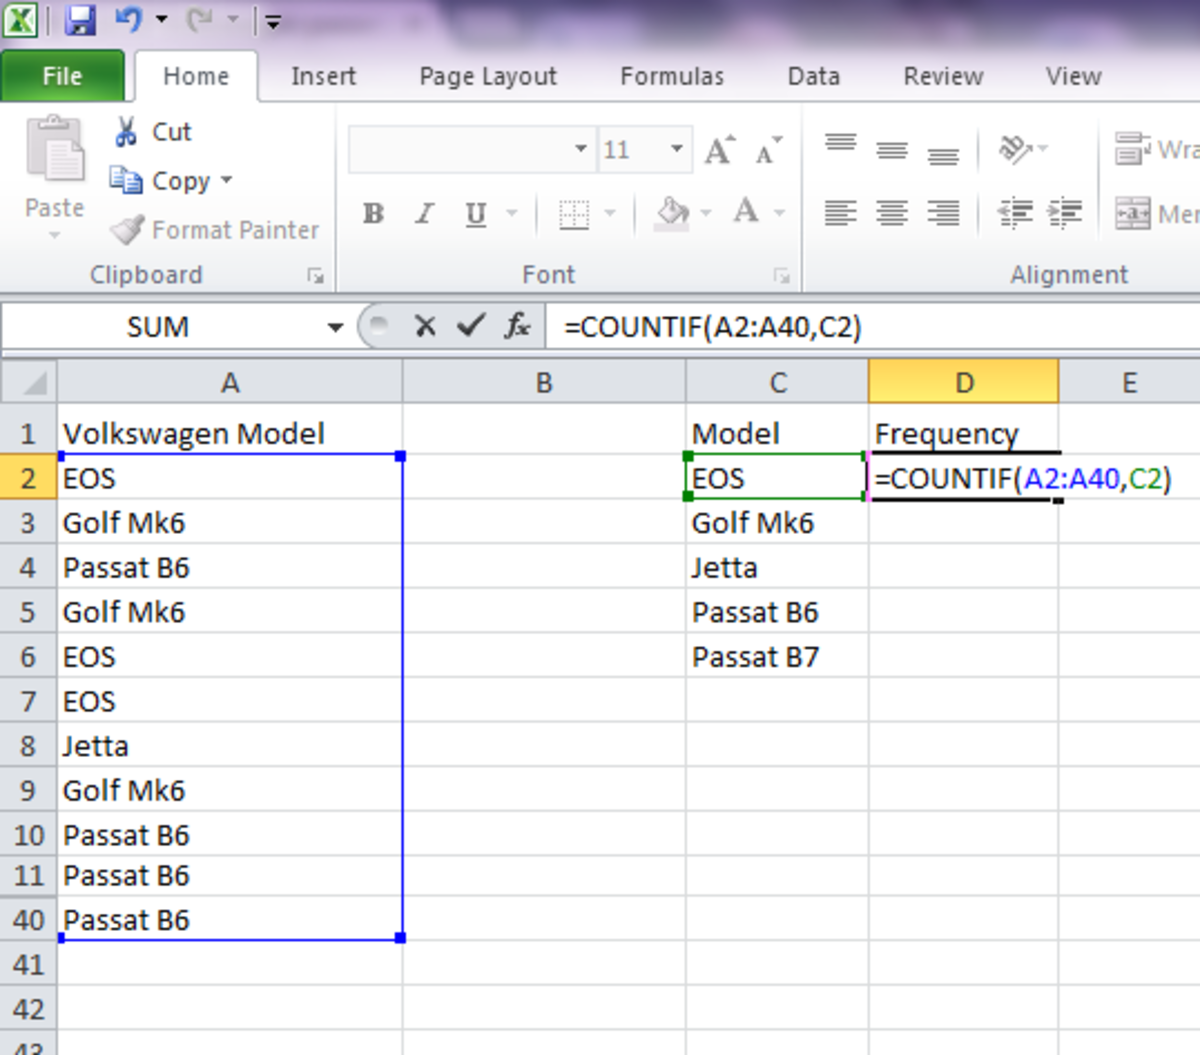
The COUNTIF function is another way to calculate frequency in Excel. It counts the number of cells within a range that meet a specified condition.
To use COUNTIF for frequency:
- Type the formula =COUNTIF(range, criteria), where range is the range of cells to count, and criteria is the condition in the form of a number, expression, cell reference, or text that defines which cells will be counted.
- Press Enter to get the count, which represents the frequency of the specified condition.
For example, =COUNTIF(A1:A100, "specific_text") counts how many cells in the range A1:A100 contain the text “specific_text”.
Method 4: Using the Analysis ToolPak

The Analysis ToolPak in Excel offers a Histogram tool that can also calculate frequencies.
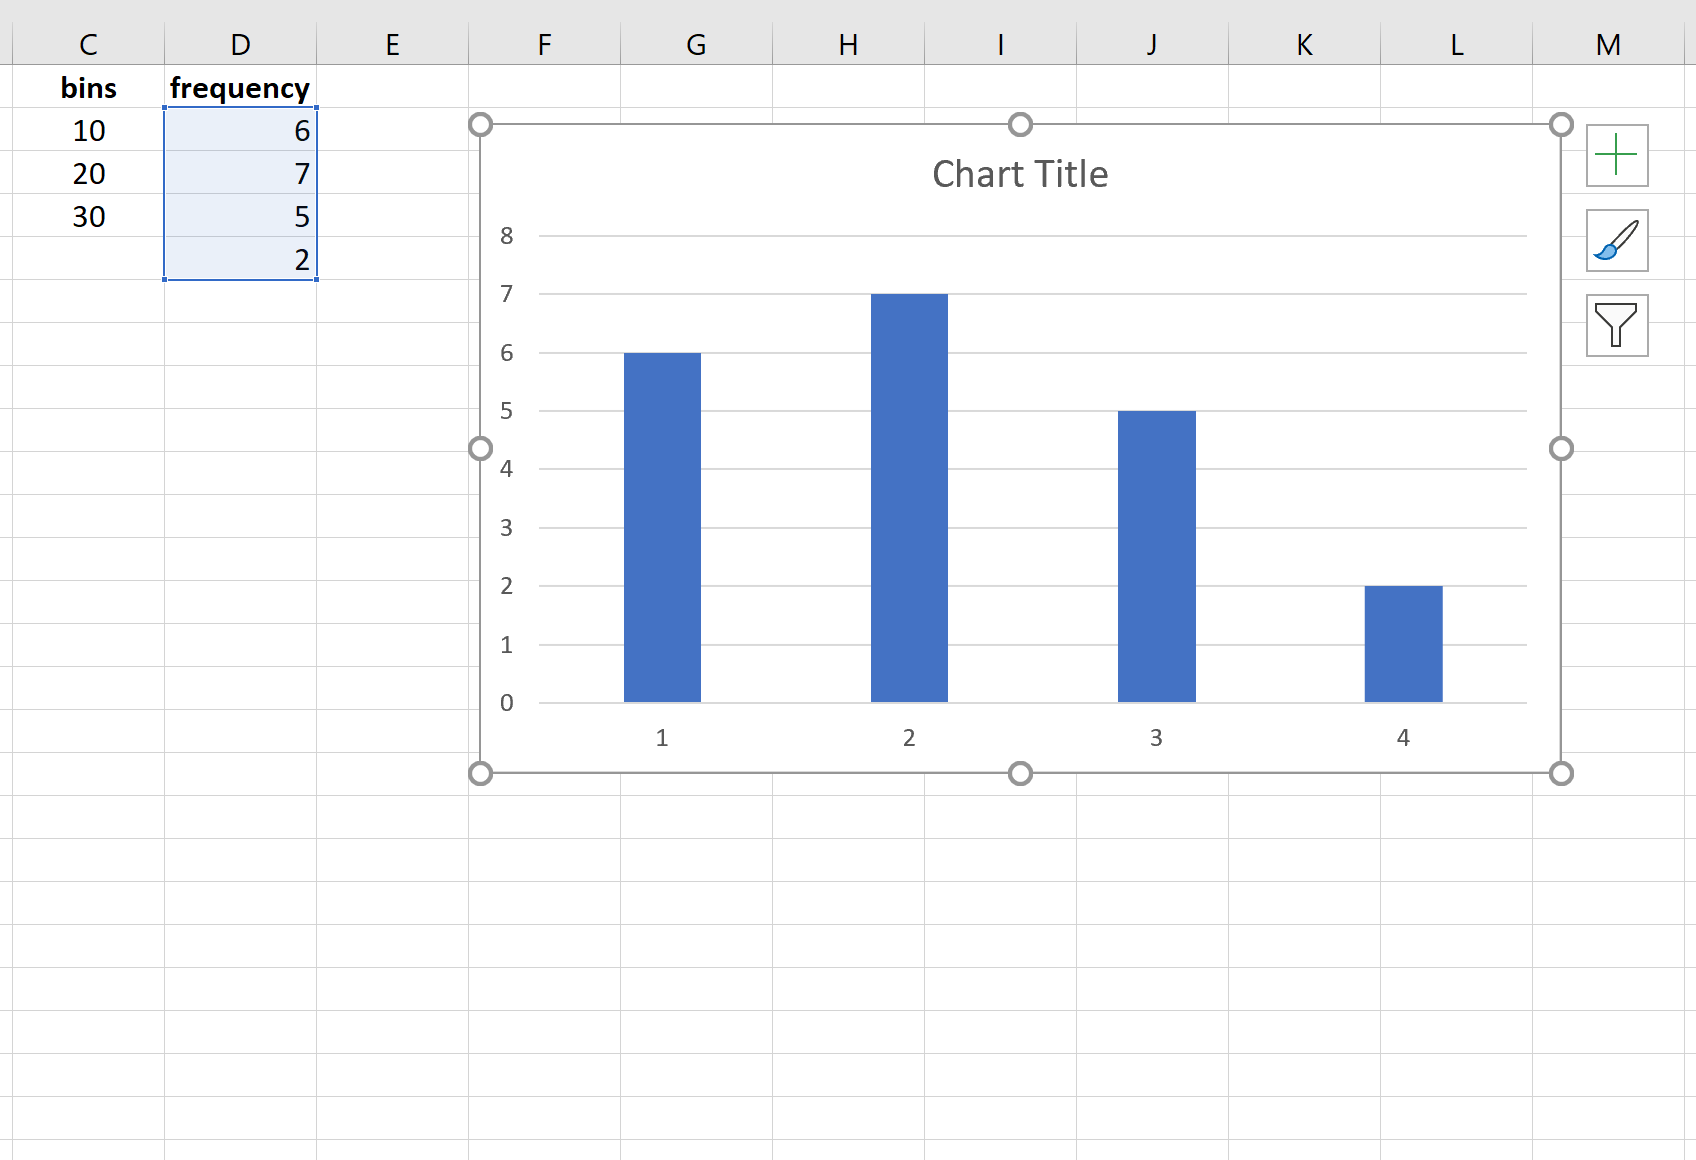
To use the Analysis ToolPak for frequency: - Ensure the Analysis ToolPak is installed and enabled in your Excel. You can do this by going to “File” > “Options” > “Add-ins”, selecting “Analysis ToolPak” from the list, and clicking OK. - Select your data range. - Go to the “Data” tab, click on “Data Analysis” in the “Analysis” group, and select “Histogram”. - In the Histogram dialog, select your “Input Range” and “Bin Range”, choose where to output the results, and check “Chart Output” if you want a visual representation. - Click OK to generate the histogram, which includes frequency counts.
Choosing the Right Method
The choice of method depends on your data and what you’re trying to achieve: - FREQUENCY function is ideal for analyzing numerical data and understanding how often values fall within certain ranges. - Pivot tables are versatile and can be used for both numerical and categorical data, offering a dynamic way to summarize data. - COUNTIF function is best for counting occurrences of specific values or conditions within a range. - Analysis ToolPak is useful when you need a graphical representation (histogram) of your data’s distribution along with the frequency counts.
📝 Note: The Analysis ToolPak might not be available in all versions of Excel or might need to be installed separately.
In conclusion, calculating frequency in Excel can be accomplished through various methods, each suited to different types of data and analysis needs. By understanding and applying these methods, you can gain deeper insights into your data, making more informed decisions in your personal or professional projects.
What is the FREQUENCY function used for in Excel?
+
The FREQUENCY function in Excel calculates how often values occur within a range of data, returning a frequency distribution as an array.
How do I create a frequency table using a pivot table in Excel?

+
To create a frequency table, select your data range, insert a pivot table, drag the field to analyze to the “Row Labels” and “Values” areas, and change the “Summarize by” option to “Count” in the “Value Field Settings” dialog.
What is the purpose of the COUNTIF function in calculating frequency?
+
The COUNTIF function counts the number of cells within a range that meet a specified condition, which can be used to calculate the frequency of specific values or conditions within a dataset.
