Get P Value On Excel
Introduction to P-Value in Excel
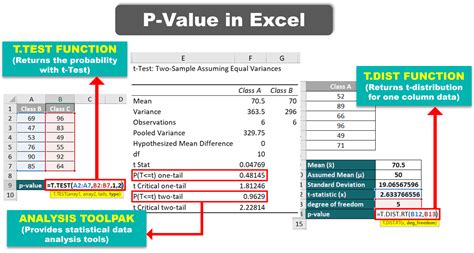
When working with statistical data in Excel, understanding the concept of P-value is crucial. The P-value, or probability value, is a key component in hypothesis testing, helping you determine the significance of your results. In this article, we’ll delve into what P-value is, how to calculate it in Excel, and interpret its meaning in the context of your data analysis.
What is P-Value?
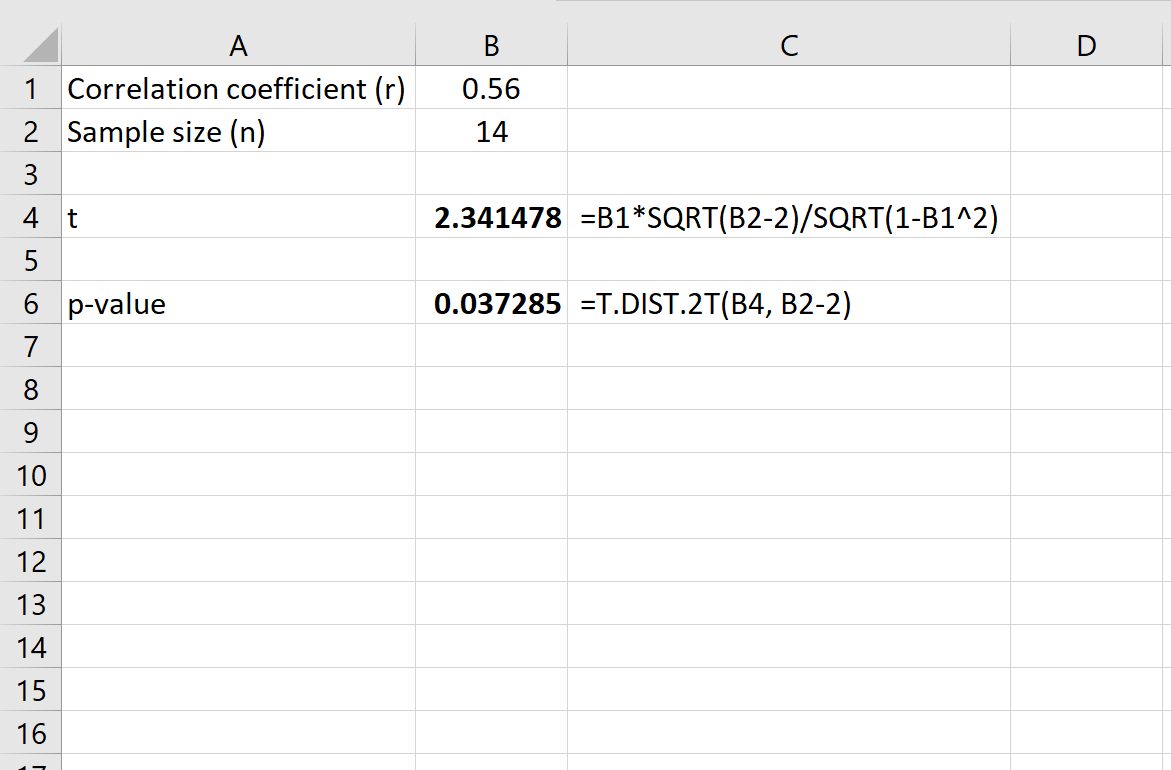
The P-value is a measure that helps you understand whether the results you’re seeing are due to chance or if they reflect a real effect. It’s the probability of observing results at least as extreme as those you’ve observed, assuming that the null hypothesis is true. The null hypothesis typically states that there is no effect or no difference. A small P-value indicates that your results are unlikely to occur by chance, suggesting that the null hypothesis can be rejected in favor of the alternative hypothesis, which typically states that there is an effect or a difference.
Calculating P-Value in Excel
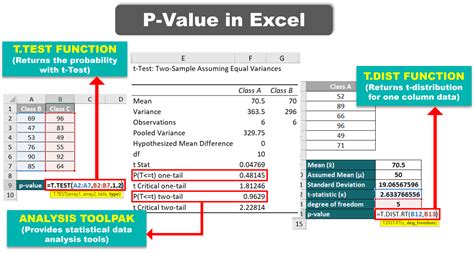
Excel provides several functions to calculate the P-value, depending on the type of test you’re conducting. Here are a few common scenarios:
For a z-test or t-test: You can use the
Z.TESTorT.TESTfunctions in Excel. These functions calculate the P-value directly based on your data.- Z.TEST(range, x, [sigma]) calculates the one-tailed P-value of a z-test.
- T.TEST(array1, array2, tails, type) calculates the P-value of a t-test.
For regression analysis: When performing linear regression, you can find the P-value associated with each coefficient in the output table generated by the
Regressiontool in the Analysis ToolPak add-in.
How to Interpret P-Value
Interpreting the P-value involves comparing it to a significance level, often denoted as alpha (α). A common choice for α is 0.05. - If the P-value is less than α (0.05), you reject the null hypothesis. This suggests that the observed effect is statistically significant. - If the P-value is greater than α (0.05), you fail to reject the null hypothesis. This indicates that the observed effect might be due to chance.
Using P-Value in Hypothesis Testing
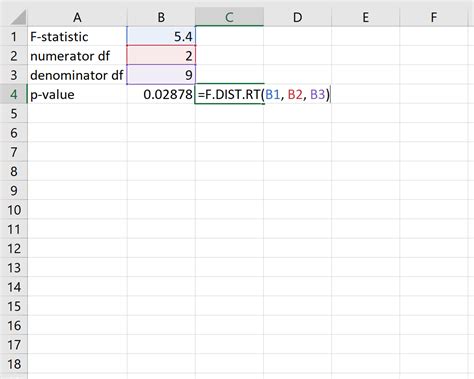
Here’s a step-by-step guide on how to use the P-value in hypothesis testing: 1. Formulate your null and alternative hypotheses. 2. Choose a significance level (α). 3. Calculate the test statistic. 4. Determine the P-value associated with the test statistic. 5. Compare the P-value to α and decide whether to reject the null hypothesis.
Example Calculation
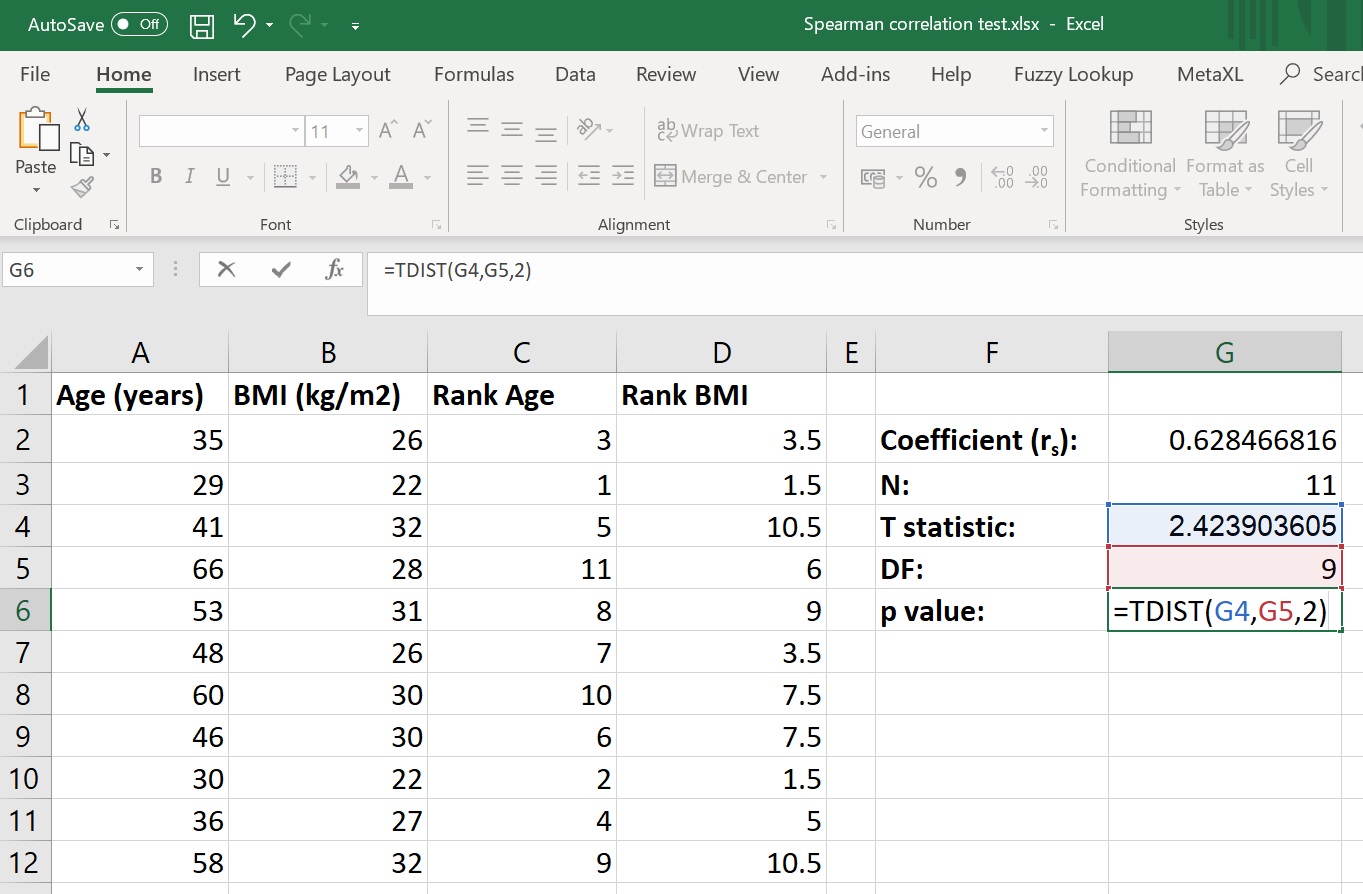
Suppose you want to compare the average exam scores of two groups of students to see if there’s a significant difference, using a t-test.
| Group | Scores |
|---|---|
| A | 85, 90, 78, 92, 88 |
| B | 76, 85, 90, 78, 95 |

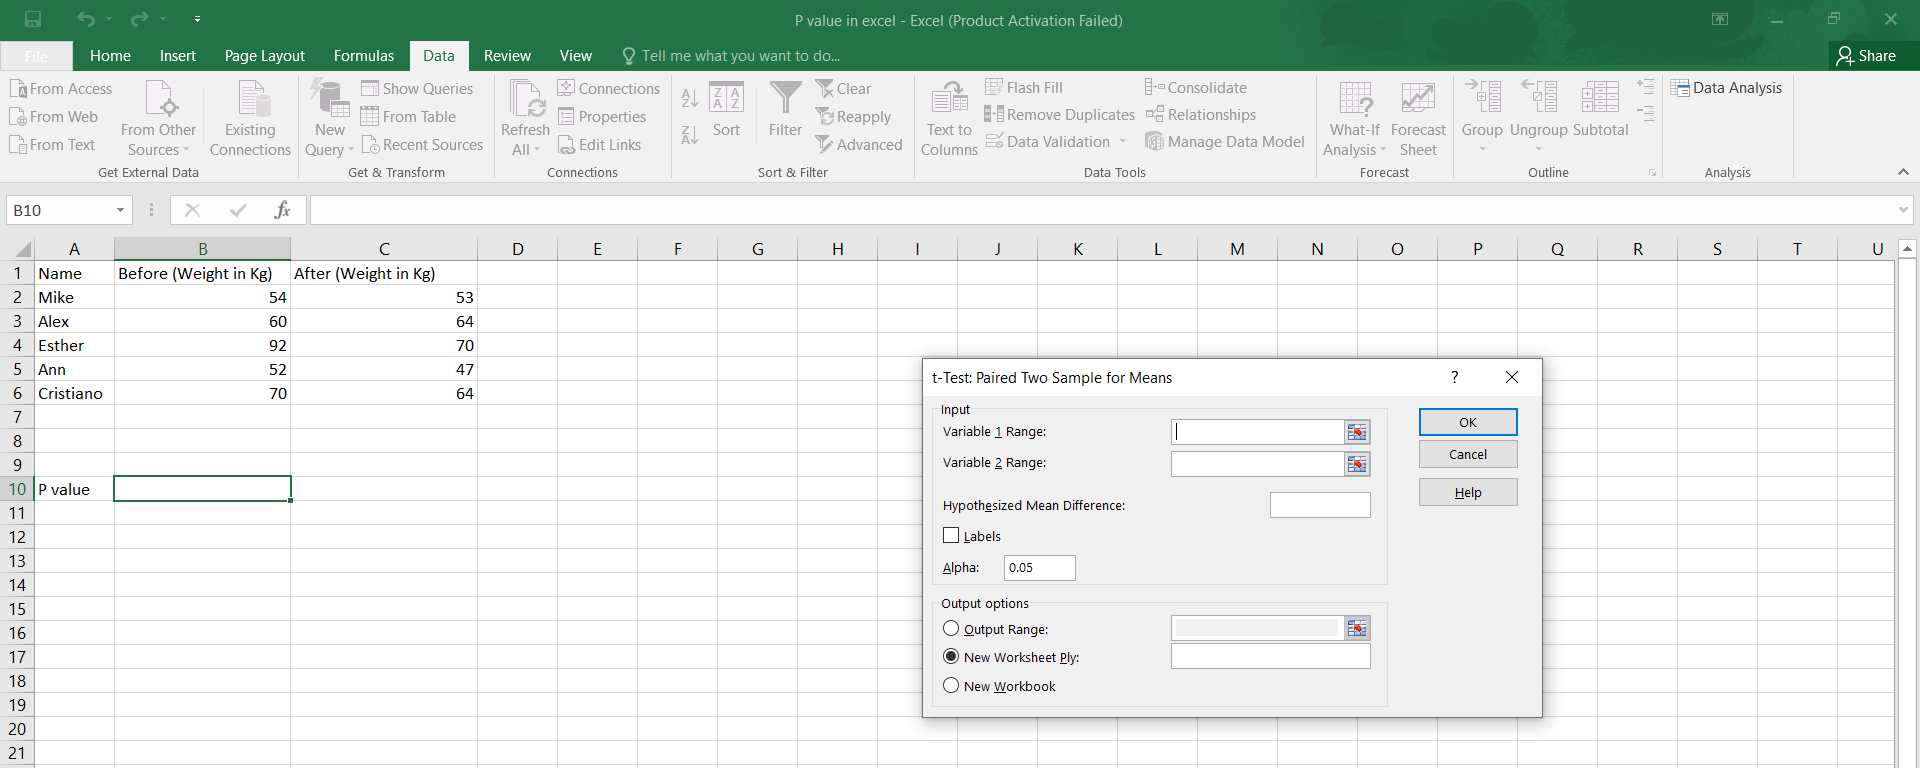
You can use the T.TEST function: =T.TEST(A2:A6, B2:B6, 2, 3), where A2:A6 and B2:B6 are the ranges containing the scores for groups A and B, respectively. The 2 indicates a two-tailed test, and the 3 specifies a paired t-test (use 1 for a one-tailed test or 2 for an unpaired t-test with equal variances).
| Group | Average Score | Standard Deviation |
|---|---|---|
| A | 86.6 | 5.51 |
| B | 84.8 | 7.13 |
Let’s say the P-value returned by the T.TEST function is 0.012.
💡 Note: A P-value of 0.012 indicates that if there were no real difference between the two groups, the probability of observing a difference at least as large as the one you've observed (or more extreme) is 1.2%. Since 0.012 is less than the typical significance level of 0.05, you would reject the null hypothesis and conclude that there is a statistically significant difference between the average exam scores of the two groups.
Advanced Considerations

- Multiple Testing: When conducting multiple tests, the risk of false positives increases. Techniques like the Bonferroni correction can help adjust for this. - Assumptions of Tests: Many statistical tests assume normality, equal variances, or independence of observations. Violating these assumptions can lead to incorrect conclusions.
Final Thoughts

The P-value is a powerful tool in statistical analysis, helping you determine the significance of your findings. However, it’s crucial to understand its limitations and to interpret it in the context of your research question and data. By following the steps outlined and considering the nuances of statistical testing, you can make informed decisions based on your data analysis.
What does a low P-value indicate?

+
A low P-value indicates that the observed effect is unlikely to occur by chance, suggesting that the null hypothesis can be rejected in favor of the alternative hypothesis.
How do I choose the significance level (α)?
+
The choice of α depends on the context of your research and the acceptable risk of false positives. A common choice is 0.05, but this can vary based on the field of study and the specific research question.
What if my data does not meet the assumptions of the test?

+
If your data does not meet the assumptions of the test (e.g., normality, equal variances), you may need to use alternative tests or transform your data to meet these assumptions. Consulting with a statistician can provide guidance tailored to your specific situation.

