Find P Value Using Excel
Introduction to P-Value and Its Importance in Statistical Analysis
The p-value, or probability value, is a key concept in statistical hypothesis testing, representing the probability of observing results at least as extreme as those observed, assuming that the null hypothesis is true. It is a crucial metric for determining the significance of a statistical test. In this blog post, we will delve into the world of p-values, their interpretation, and most importantly, how to find them using Excel, a widely used spreadsheet software.
Understanding P-Values
Before we dive into the process of finding p-values in Excel, it’s essential to understand what p-values represent and how they are interpreted. A p-value: - Indicates the strength of evidence against a null hypothesis. - Ranges from 0 to 1, where: - A p-value close to 0 suggests strong evidence against the null hypothesis, indicating that the observed data would be very unlikely under the null hypothesis. - A p-value close to 1 suggests weak evidence against the null hypothesis, indicating that the observed data are likely under the null hypothesis. - Is compared to a significance level (α), typically set at 0.05. If the p-value is less than α, the null hypothesis is rejected, suggesting that the observed effect is statistically significant.
Calculating P-Values in Excel
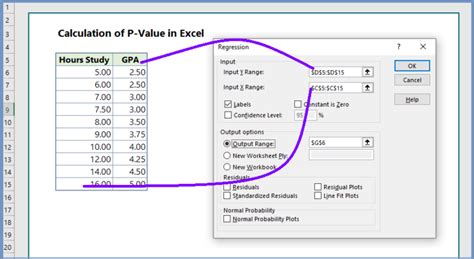
Excel provides several functions to calculate p-values for various statistical tests. Here, we’ll focus on calculating p-values for a two-tailed t-test, one of the most common statistical tests.
Steps to Calculate P-Value for a Two-Tailed T-Test:

- Organize Your Data: Ensure your data is organized into two columns, one for each group you are comparing.
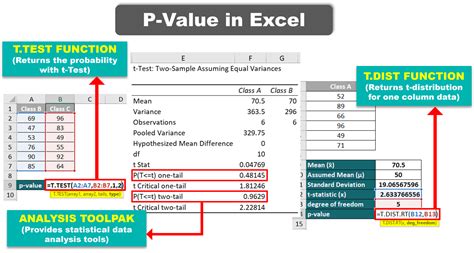
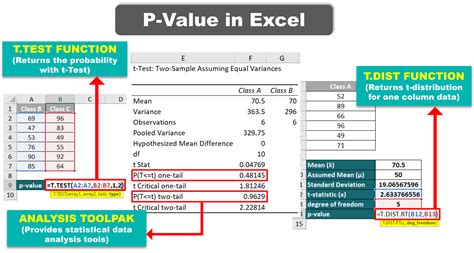
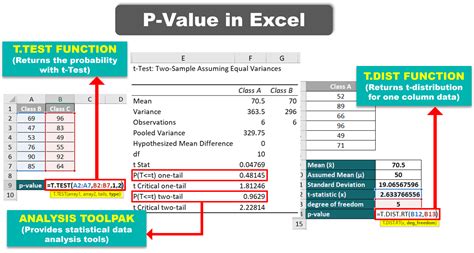
- Use the T.TEST Function: The T.TEST function in Excel calculates the p-value for a t-test. The syntax for a two-tailed test is
T.TEST(array1, array2, tails, type).array1andarray2are the ranges of the two data sets.tailsis set to 2 for a two-tailed test.typeis set to 1 for a paired test, 2 for a two-sample test assuming equal variances, and 3 for a two-sample test assuming unequal variances.
Example Calculation:
Suppose we have two sets of exam scores, and we want to determine if there is a significant difference between them.
- Data: Group A scores are in cells A1:A10, and Group B scores are in cells B1:B10.
- Formula: =T.TEST(A1:A10, B1:B10, 2, 2) assumes equal variances.
Interpreting P-Values in the Context of Your Research
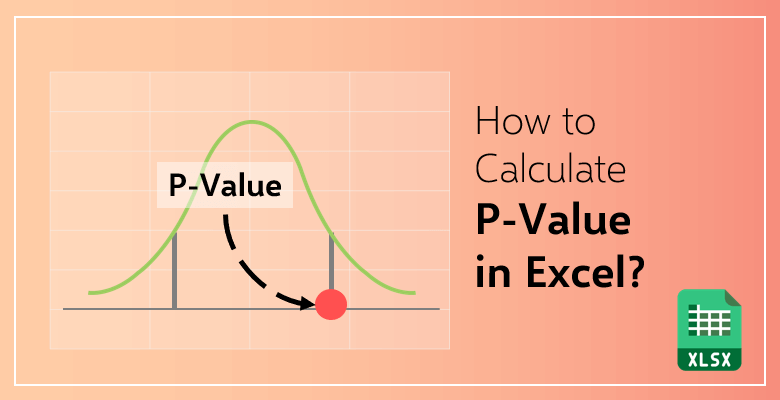
After calculating the p-value, the next step is to interpret it in the context of your research question. Remember: - A low p-value (typically less than 0.05) suggests that the observed difference is statistically significant, leading to the rejection of the null hypothesis. - A high p-value suggests that the observed difference is not statistically significant, leading to the failure to reject the null hypothesis.
📝 Note: It's crucial to consider the research context and not solely rely on the p-value for making conclusions. Other factors, such as the study design, sample size, and effect size, should also be considered.
Common Mistakes in Interpreting P-Values
When interpreting p-values, researchers often fall into several traps: - Misinterpreting the p-value as the probability that the null hypothesis is true, which it is not. - Overemphasizing statistical significance while ignoring practical significance. - Failing to consider multiple testing, which can lead to false positives.
Avoiding These Mistakes:
- Understand what the p-value represents: It’s about the probability of observing your data (or more extreme) given that the null hypothesis is true, not the probability that the null hypothesis is true.
- Consider the effect size: Consider not just whether an effect is statistically significant but also whether it is practically significant.
- Adjust for multiple comparisons: Use techniques like the Bonferroni correction to adjust your significance level when conducting multiple tests.
Using P-Values for Informed Decision Making

P-values are a tool, not the ultimate decision-maker. By understanding and correctly interpreting p-values, researchers and analysts can make more informed decisions about their data and hypotheses.
Table: P-Value Interpretation Guidelines

| P-Value Range | Interpretation |
|---|---|
| p ≤ 0.01 | Strong evidence against the null hypothesis |
| 0.01 < p ≤ 0.05 | Moderate evidence against the null hypothesis |
| 0.05 < p ≤ 0.10 | Weak evidence against the null hypothesis |
| p > 0.10 | Very weak evidence against the null hypothesis |
In summary, p-values are a crucial component of statistical hypothesis testing, providing insight into the significance of observed effects. By correctly calculating and interpreting p-values, using tools like Excel, and considering the broader context of the research, including potential pitfalls in interpretation, researchers can make more informed decisions about their hypotheses and contribute meaningfully to their field of study.
What does a p-value of 0.05 indicate?
+
A p-value of 0.05 indicates that if the null hypothesis were true, the probability of observing the results you have (or more extreme) is 5%. This is typically considered the threshold for statistical significance, leading to the rejection of the null hypothesis.
How do I calculate a p-value in Excel for a one-tailed t-test?
+
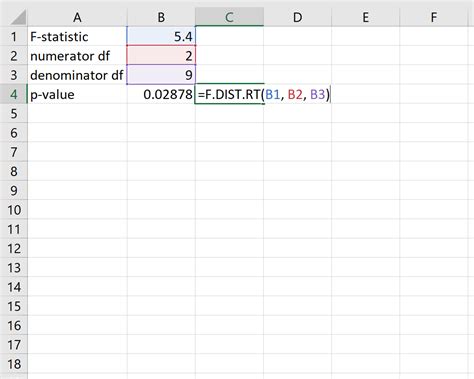
To calculate a p-value for a one-tailed t-test in Excel, you use the T.TEST function with the “tails” argument set to 1. For example, =T.TEST(array1, array2, 1, 2) for a one-tailed test assuming equal variances.
What is the difference between a one-tailed and a two-tailed test?
+
A one-tailed test (or one-sided test) is used when the alternative hypothesis specifies a direction of the effect (e.g., Group A is better than Group B). A two-tailed test (or two-sided test) is used when the direction of the effect is not specified (e.g., Group A is different from Group B, without specifying which is better). The choice between them depends on the research question.

