Find P Value in Excel

Introduction to P-Value in Excel
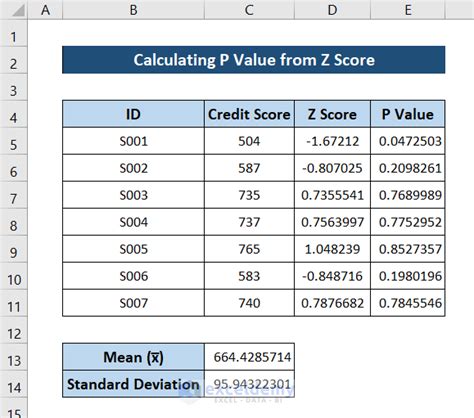
The p-value, or probability value, is a key concept in statistical hypothesis testing, representing the probability of observing results at least as extreme as those observed, assuming that the null hypothesis is true. In Excel, calculating the p-value can be a bit tricky, but it’s a crucial step in understanding the significance of your data. In this article, we’ll explore how to find the p-value in Excel, using various methods and functions.
Understanding P-Value
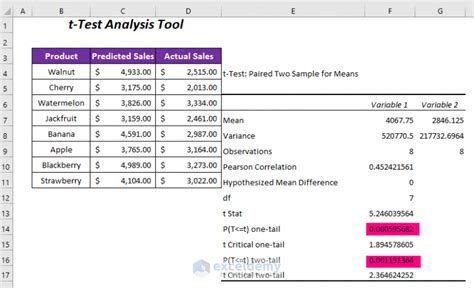
Before diving into the calculation, it’s essential to understand what the p-value represents. The p-value is a measure of the strength of evidence against a null hypothesis. A small p-value (typically less than 0.05) indicates strong evidence against the null hypothesis, while a large p-value indicates weak evidence. The p-value is not the probability of the null hypothesis being true, but rather the probability of observing the data (or more extreme data) assuming the null hypothesis is true.
Using the T.TEST Function
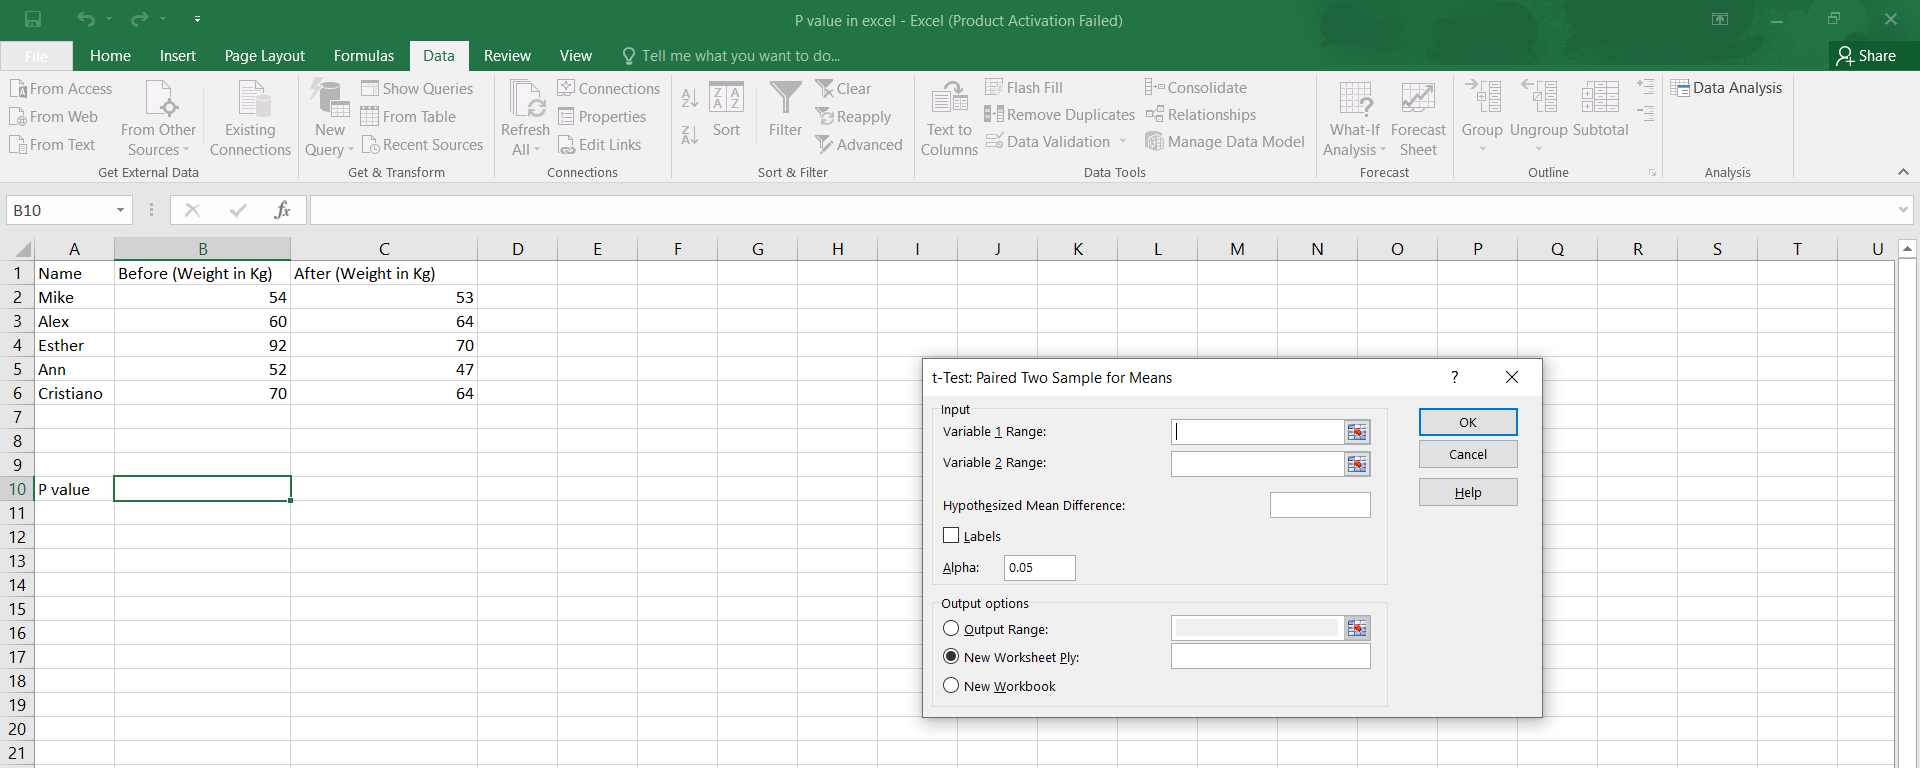
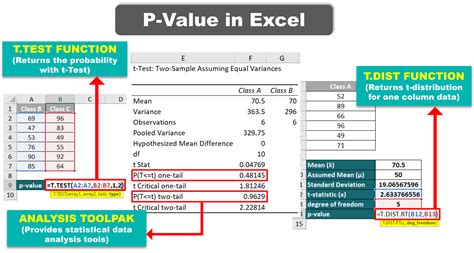
One of the most common ways to calculate the p-value in Excel is by using the T.TEST function. This function performs a two-sample t-test, which is used to compare the means of two groups. The syntax for the T.TEST function is: T.TEST(array1, array2, tails, type) Where: - array1 and array2 are the ranges of data for the two groups - tails is the number of tails (1 for a one-tailed test, 2 for a two-tailed test) - type is the type of t-test (1 for a paired test, 2 for a two-sample test, 3 for a test with unequal variances)
For example, suppose we have two samples of exam scores, and we want to determine if there’s a significant difference between the means of the two groups. We can use the T.TEST function to calculate the p-value: =T.TEST(A1:A10, B1:B10, 2, 2) This formula will return the p-value for the two-tailed test.
Using the Z.TEST Function
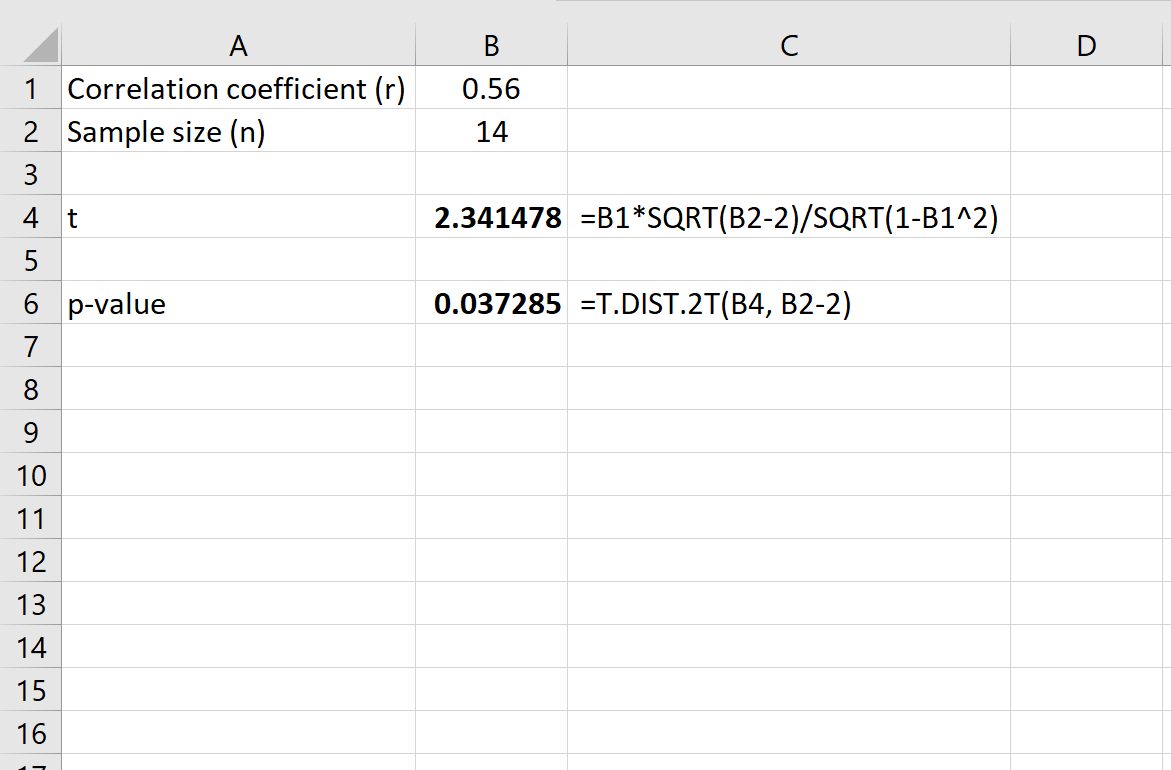
Another way to calculate the p-value in Excel is by using the Z.TEST function. This function performs a z-test, which is used to compare the mean of a sample to a known population mean. The syntax for the Z.TEST function is: Z.TEST(array, x, sigma) Where: - array is the range of data - x is the known population mean - sigma is the known population standard deviation
For example, suppose we have a sample of heights, and we want to determine if the mean height is significantly different from a known population mean of 175 cm. We can use the Z.TEST function to calculate the p-value: =Z.TEST(A1:A10, 175, 5) This formula will return the p-value for the test.
Using the F.TEST Function
The F.TEST function is used to perform an F-test, which is used to compare the variances of two groups. The syntax for the F.TEST function is: F.TEST(array1, array2) Where: - array1 and array2 are the ranges of data for the two groups
For example, suppose we have two samples of scores, and we want to determine if the variances of the two groups are significantly different. We can use the F.TEST function to calculate the p-value: =F.TEST(A1:A10, B1:B10) This formula will return the p-value for the test.
Using Analysis ToolPak

Excel’s Analysis ToolPak (ATP) is an add-in that provides a range of statistical tools, including hypothesis testing. To access the ATP, go to the “Data” tab, click “Data Analysis,” and select “t-Test: Two-Sample Assuming Equal Variances” or “t-Test: Two-Sample Assuming Unequal Variances.” Follow the prompts to select the data ranges and options, and the ATP will calculate the p-value for you.
Interpreting P-Value Results
Once you’ve calculated the p-value, you need to interpret the results. A small p-value (typically less than 0.05) indicates strong evidence against the null hypothesis, while a large p-value indicates weak evidence. Here are some general guidelines for interpreting p-value results: - p-value < 0.01: Very strong evidence against the null hypothesis - p-value < 0.05: Strong evidence against the null hypothesis - p-value < 0.1: Weak evidence against the null hypothesis - p-value > 0.1: Very weak evidence against the null hypothesis
💡 Note: The p-value is not the probability of the null hypothesis being true, but rather the probability of observing the data (or more extreme data) assuming the null hypothesis is true.
Common Mistakes to Avoid

When working with p-values in Excel, there are some common mistakes to avoid: - Misinterpreting the p-value: Remember that the p-value is not the probability of the null hypothesis being true, but rather the probability of observing the data (or more extreme data) assuming the null hypothesis is true. - Using the wrong test: Make sure to choose the correct statistical test for your data and research question. - Ignoring assumptions: Many statistical tests assume that the data meets certain criteria (e.g., normality, equal variances). Make sure to check these assumptions before interpreting the results.
| Test | Description | Assumptions |
|---|---|---|
| T-Test | Compares means of two groups | Normality, equal variances |
| Z-Test | Compares mean of sample to known population mean | Normality, known population standard deviation |
| F-Test | Compares variances of two groups | Normality, equal variances |

In conclusion, calculating the p-value in Excel is a crucial step in understanding the significance of your data. By using the T.TEST, Z.TEST, or F.TEST functions, or by using the Analysis ToolPak, you can determine the probability of observing your results (or more extreme results) assuming the null hypothesis is true. Remember to interpret the results carefully, avoiding common mistakes and considering the assumptions of the test. With practice and patience, you’ll become proficient in using Excel to calculate and interpret p-values, and you’ll be well on your way to becoming a skilled data analyst.
What is the difference between a one-tailed and two-tailed test?
+
A one-tailed test is used to determine if there is a significant difference between the mean of a sample and a known population mean, in a specific direction (e.g., is the sample mean greater than the population mean?). A two-tailed test is used to determine if there is a significant difference between the mean of a sample and a known population mean, in either direction (e.g., is the sample mean greater than or less than the population mean?).
How do I choose the correct statistical test for my data?
+
The choice of statistical test depends on the research question, the type of data, and the level of measurement. Consider the following factors: the number of groups, the type of data (continuous, categorical, etc.), and the level of measurement (nominal, ordinal, interval, etc.). Consult with a statistician or a statistical textbook to determine the most appropriate test for your data.
What is the significance of the p-value in hypothesis testing?

+
The p-value represents the probability of observing the data (or more extreme data) assuming the null hypothesis is true. A small p-value (typically less than 0.05) indicates strong evidence against the null hypothesis, while a large p-value indicates weak evidence. The p-value is not the probability of the null hypothesis being true, but rather a measure of the strength of evidence against the null hypothesis.

